Power BI Training Guide
The Power of Power BI
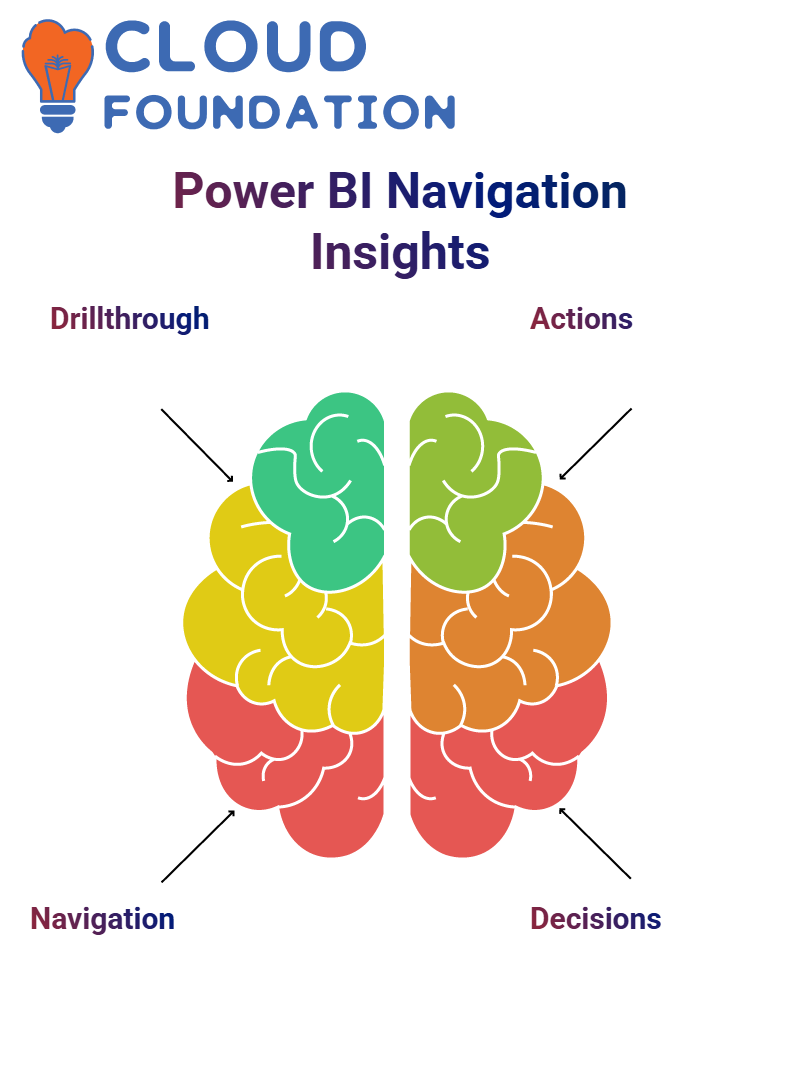
Power BI is an invaluable tool that transforms data into actionable insights. Working with this software gives you the power to navigate different pages like an ordinary web browser, easily moving forward or backwards.
One of the best features in Power BI is the drill-through capability. Reviewing an executive summary, looking to hone in on specific products that generated maximum profit.
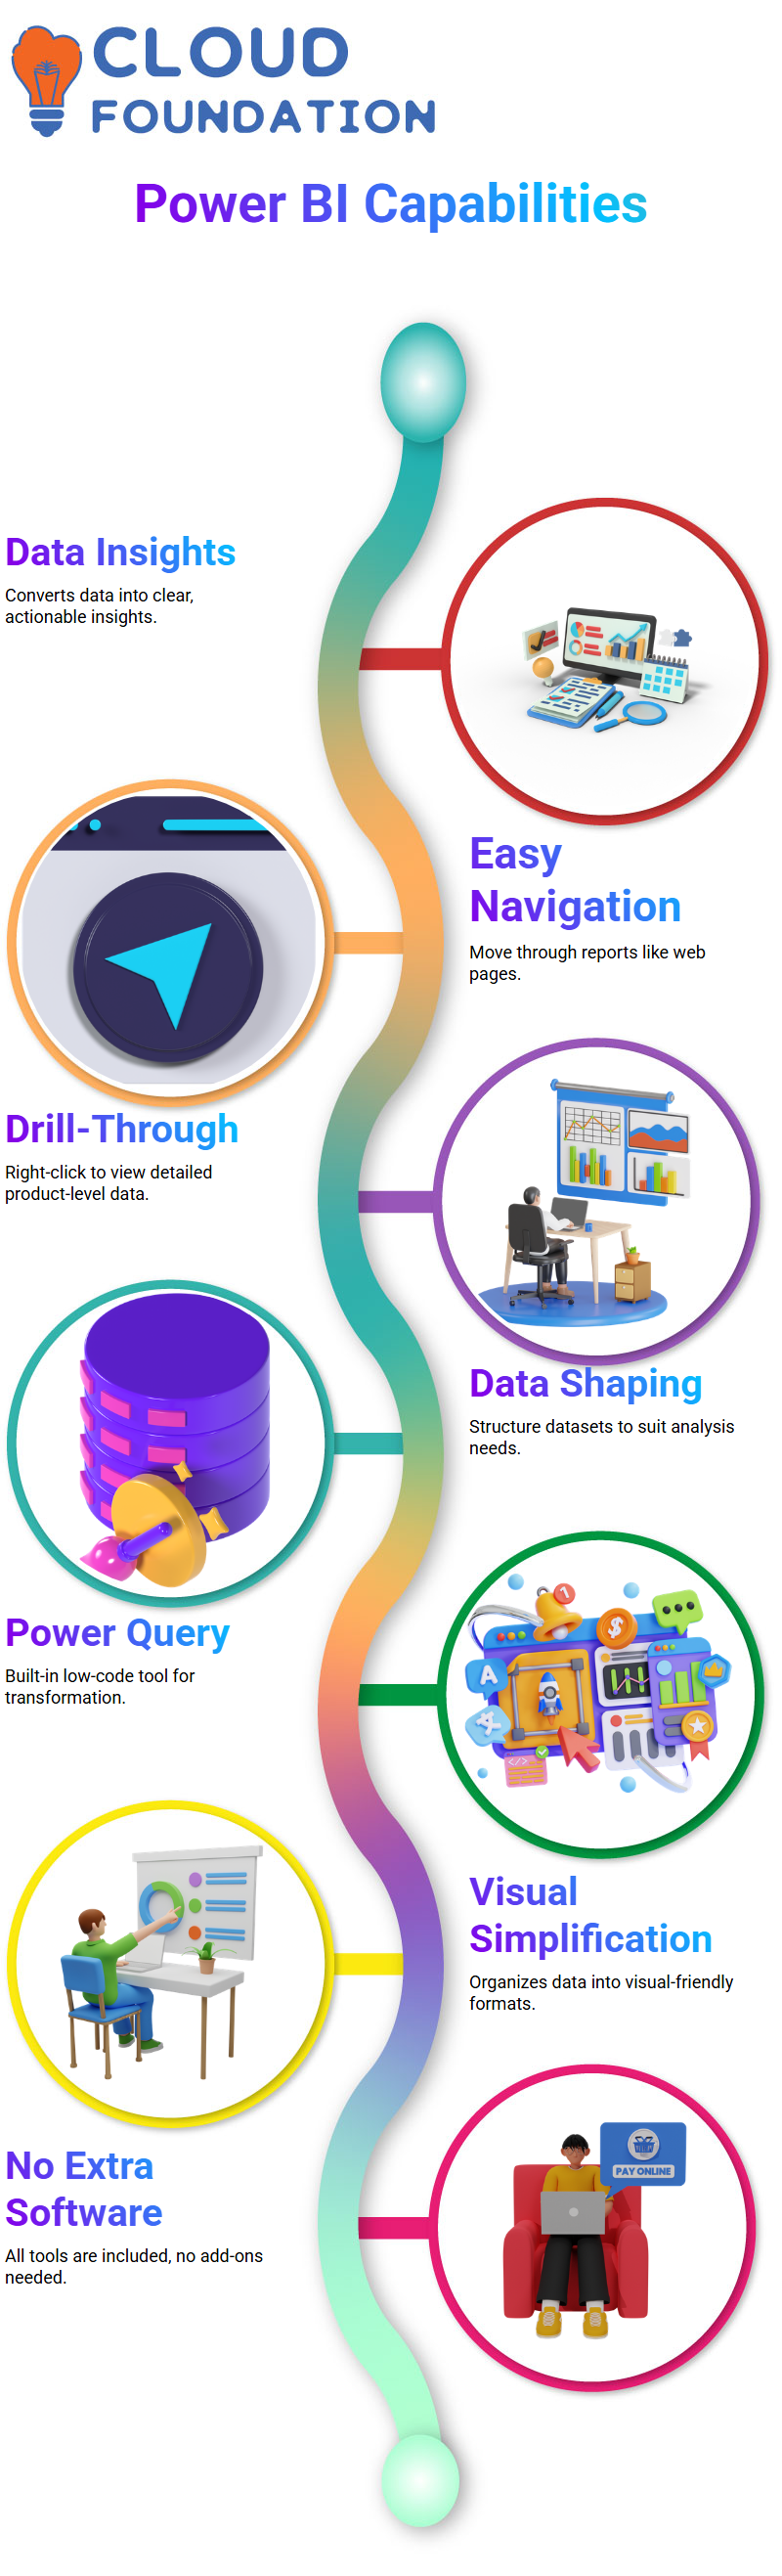
For instance, Mountain 200 Black Fortices stands out in your dataset. Right-click and select ‘drill-through’ to open a detailed page where you can investigate further.
Power BI with Data Transformation
Power BI is an incredible tool that makes working with data painless. To be efficient at handling large datasets, extracting, transforming and visualising effectively.
Power BI’s transformation feature helps us shape and structure data to fit our analysis requirements, such as making visualisation easier with Power Query.
The transformation feature helps provide structure for better analysis by organising information in specific formats for visualisation purposes.
Power Query is already built into Power BI and utilises low-code technology, eliminating the need for additional software to handle complex data tasks without requiring complex coding.
Power Query in Power BI
Power Query is an unparalleled asset. Equipped with its language, M, Power Query provides a means of customising scripts while remaining intuitive for users.
Most tasks can be accomplished simply through drag-and-drop operations, while behind the scenes, it generates scripts written specifically in M language to execute transformations.
Accessing Power Query in Power BI is straightforward. From the Home ribbon, we click ‘Transform Data’ to enter Power Query’s environment, where we will find our queries data tables we work with all conveniently organised for us.
On the left is a list of queries, while on the right, we see the settings with the applied steps for those queries. Power BI automatically organises our data by promoting headers and assigning appropriate data types, such as text or dates.
Power BI Data Modelling
Power BI is an efficient data analysis and visualisation platform, and one of its standout features is its data modelling capabilities, which help organise and structure information to provide greater insights.
Power BI makes working with structured data easy by creating seamless relationships among datasets. As an illustration, let’s use a simple dataset that I’ve created myself, so you can quickly grasp the core principles of Power BI Data modelling.
Power BI Desktop allows us to manually enter data, just as we do when using Power Query. I created two tables one representing departments and another representing teams with Employee ID as the connecting column between them, allowing for meaningful relationships to be formed.
Cross-filter direction plays a crucial role in the data flow across tables in Power BI. Because these linked, bidirectional tables share filters between themselves, influencing which way the information moves across them seamlessly, enabling us to analyse interrelated datasets seamlessly.
Power BI modelling requires an understanding of fact tables as one of its core tenets, since fact tables contain numerical values that measure business processes. Transactional information, such as employee details or salaries, could reside here.
Dimension Tables in Power BI
Power BI’s relationship management can be significantly enhanced by adding dimension tables. A dimension table acts as an intermediary, connecting skillset and diversity data without directly interfering with the tables.
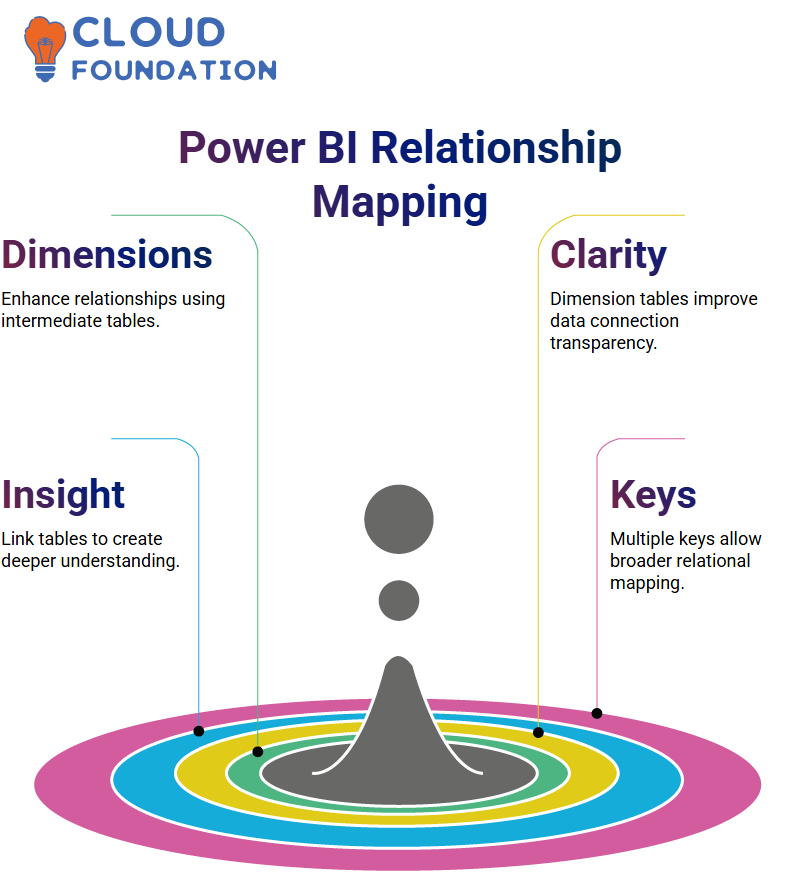
Power BI’s indirect linkages between skillset and diversity tables, facilitated through dimension tables, provide greater clarity, making their use an efficient method of managing many-to-many relationships without directly disrupting functionality.
Building Relationships in Power BI
Power BI provides us with tools for efficiently analysing data. By linking employee tables to department tables and department tables to diversity tables, we create crucial connections that amplify our insight.
As soon as the employee ID was added to the mix, we transitioned from having one-to-one relationships to having multiple keys linked with various values related to a single key.
Some records may appear duplicated, indicating that various values correspond to a single key value.

Power BI Training
Cardinality in Power BI
Cardinality plays a crucial role in Power BI for defining relationships. A one-to-many or many-to-one link functions similarly and efficiently directs data flows.
By default, Power BI applies a single cross-filter direction, meaning only dimension tables control fact tables.
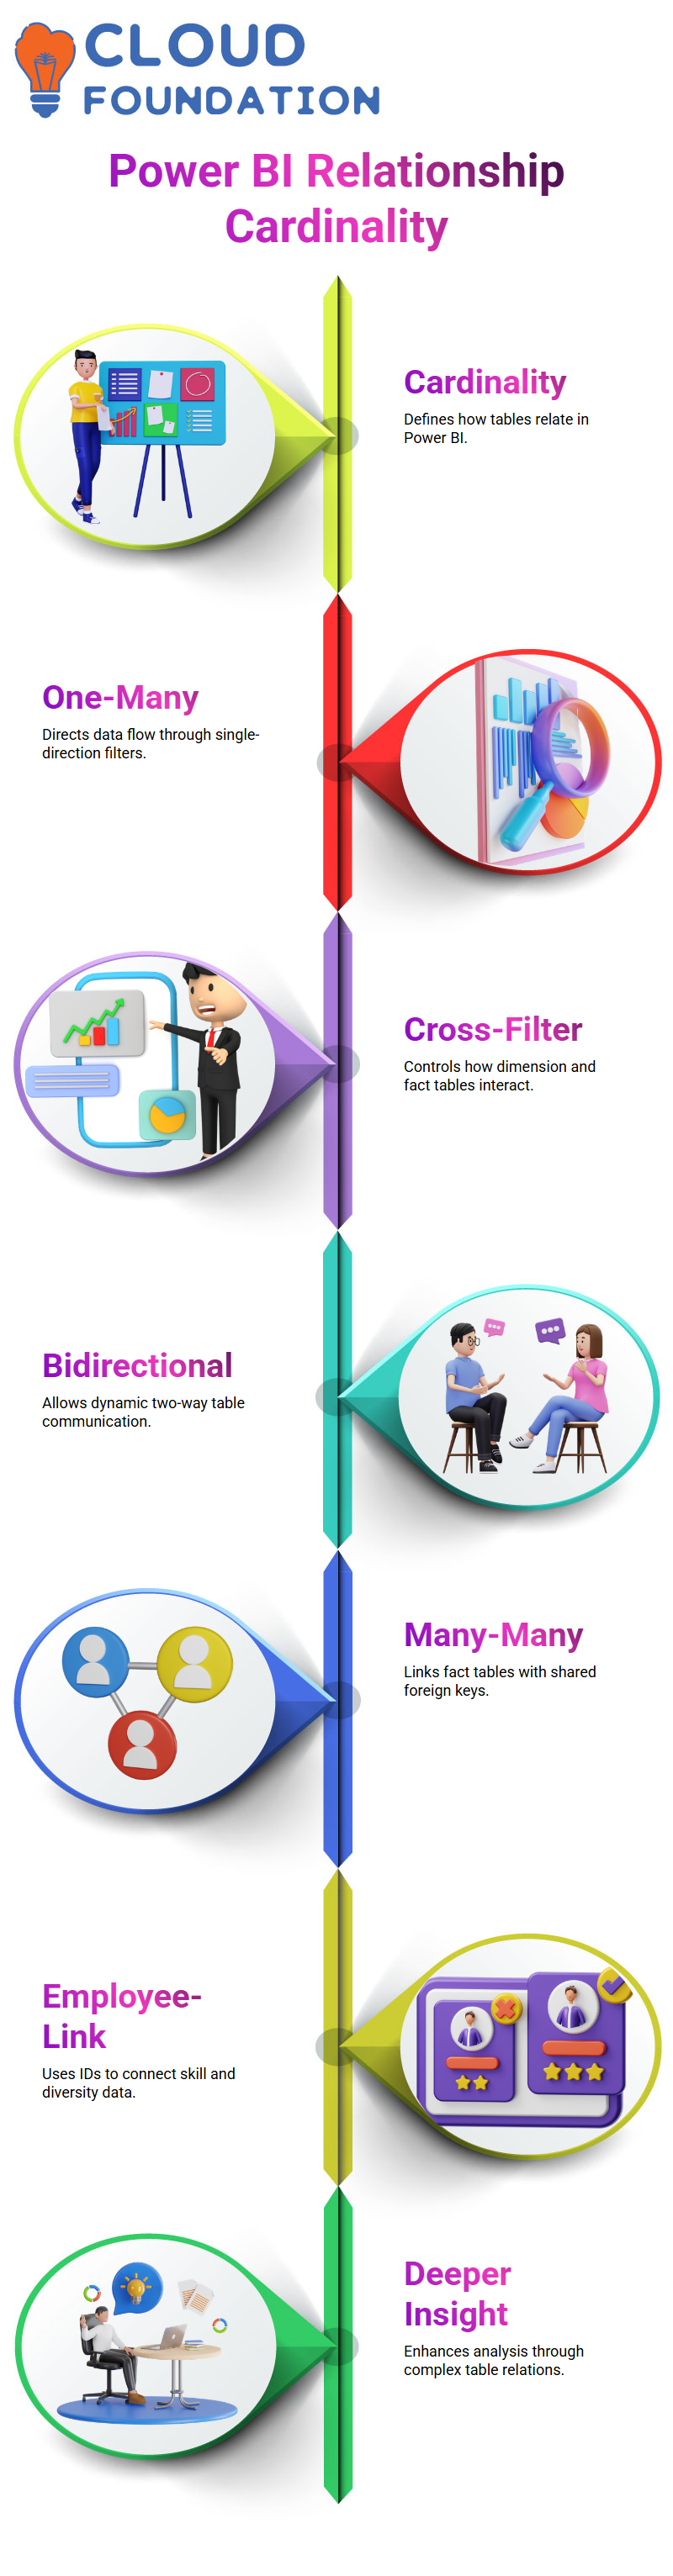
However, we can modify this setting to allow them to interact dynamically with one another.
Many-to-Many Cardinality in Power BI
Power BI’s Many-to-Many cardinality adds another level of complexity by connecting fact tables that share foreign keys to form deeper associations between facts.
Example: An employee skills table could link with diversity tables via employee IDs, providing additional analytical scope and supporting greater insights.
Managing Relationships in Power BI
Power BI’s relationships allow data models to interact. One essential type is the many-to-many relationship, which can cause some degree of confusion if not managed appropriately.
Power BI advises users that multi-to-many relationships should only be applied when neither table contains distinct values; otherwise, it may result in unexpected behaviour when reporting and visualising reports and visuals.
As a result, understanding Power BI’s disclaimers and implications is vital before beginning work on these types of analyses.
Power BI’s skillset table displays all corresponding results from its diversity table when creating relationships, highlighting the many-to-many nature of these relationships. Clicking an employee ID may yield multiple results due to interactions among tables.
Power BI enables us to define relationships manually or through managed relationship tabs, making data integration more straightforward than ever. Through tabular analysis, we can link fact tables seamlessly.
Setting relationships to “both” simplifies communication among tables, making Power BI more user-friendly and productive.
Deactivating Relationships in Power BI
Power BI allows users to easily activate or deactivate relationships within its framework, either temporarily by deactivating them in models without impacting interactions, or permanently by deleting them.
Deleting alters how tables connect in its framework. Power BI makes activating relationships easy through just one click, as its bold line indicates active connections between tables that impact how it processes queries and displays results.
Cross-Filtering in Power BI
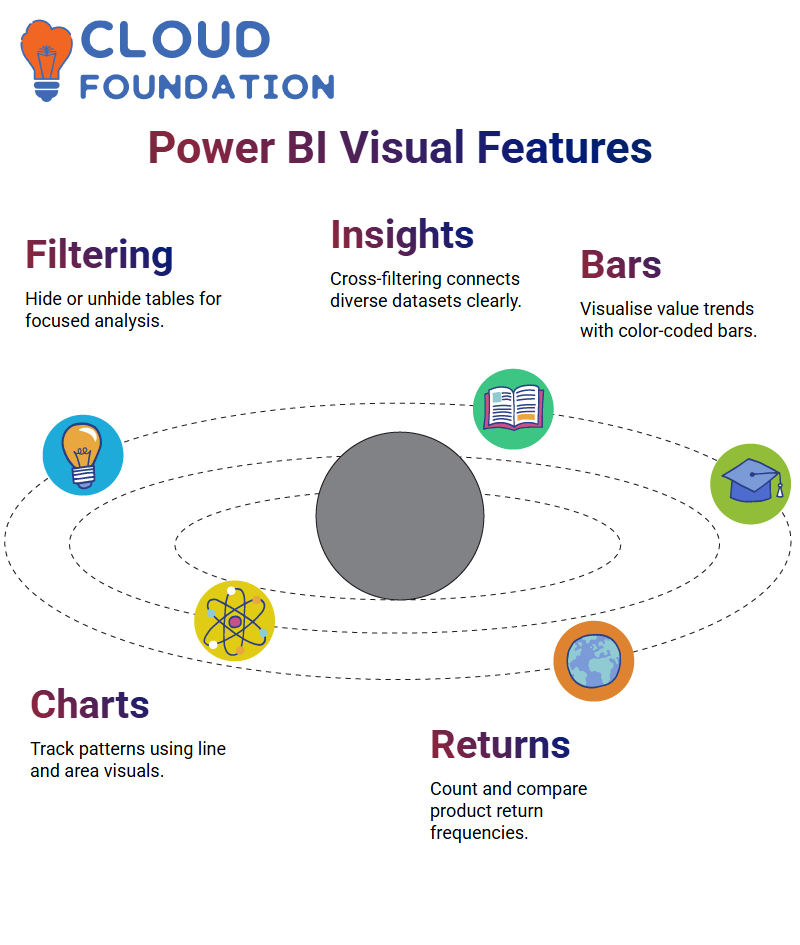
Power BI’s cross-filtering functionality enables flexible data exploration by hiding or unhiding tables to increase clarity and focus on specific relationships.
Power BI allows us to set cross-filtering for both and provide insights from diverse data for departmental insights, while remaining connected to employee tables.
Power BI Data Bars
My favourite feature in Power BI is its data bar formatting feature, as this makes spotting positive and negative values faster and simpler than ever.
 Power BI makes customising visualisation elements simple. I adjusted the colour scheme so numbers remain visible, and using lighter hues for positive values made my table much more readable.
Power BI Line and Area Charts
Line and area charts both display data differently. Power BI’s line chart functionality makes both options useful in effectively tracking trends over time, including plotting start-of-month metrics with return statistics to get an in-depth view of monthly return patterns.
Going beyond simple return tracking, we employ measures such as Return Count, which tracks both the total number of returns and the frequency of product returns.

Power BI Online Training
Power BI’s Trellis Charts
Trellis charts in Power BI provide a more advanced version of pie charts, incorporating additional axes for in-depth analysis of distribution.
Power BI also features 100% stacked bar charts to ensure data is presented clearly and effectively.
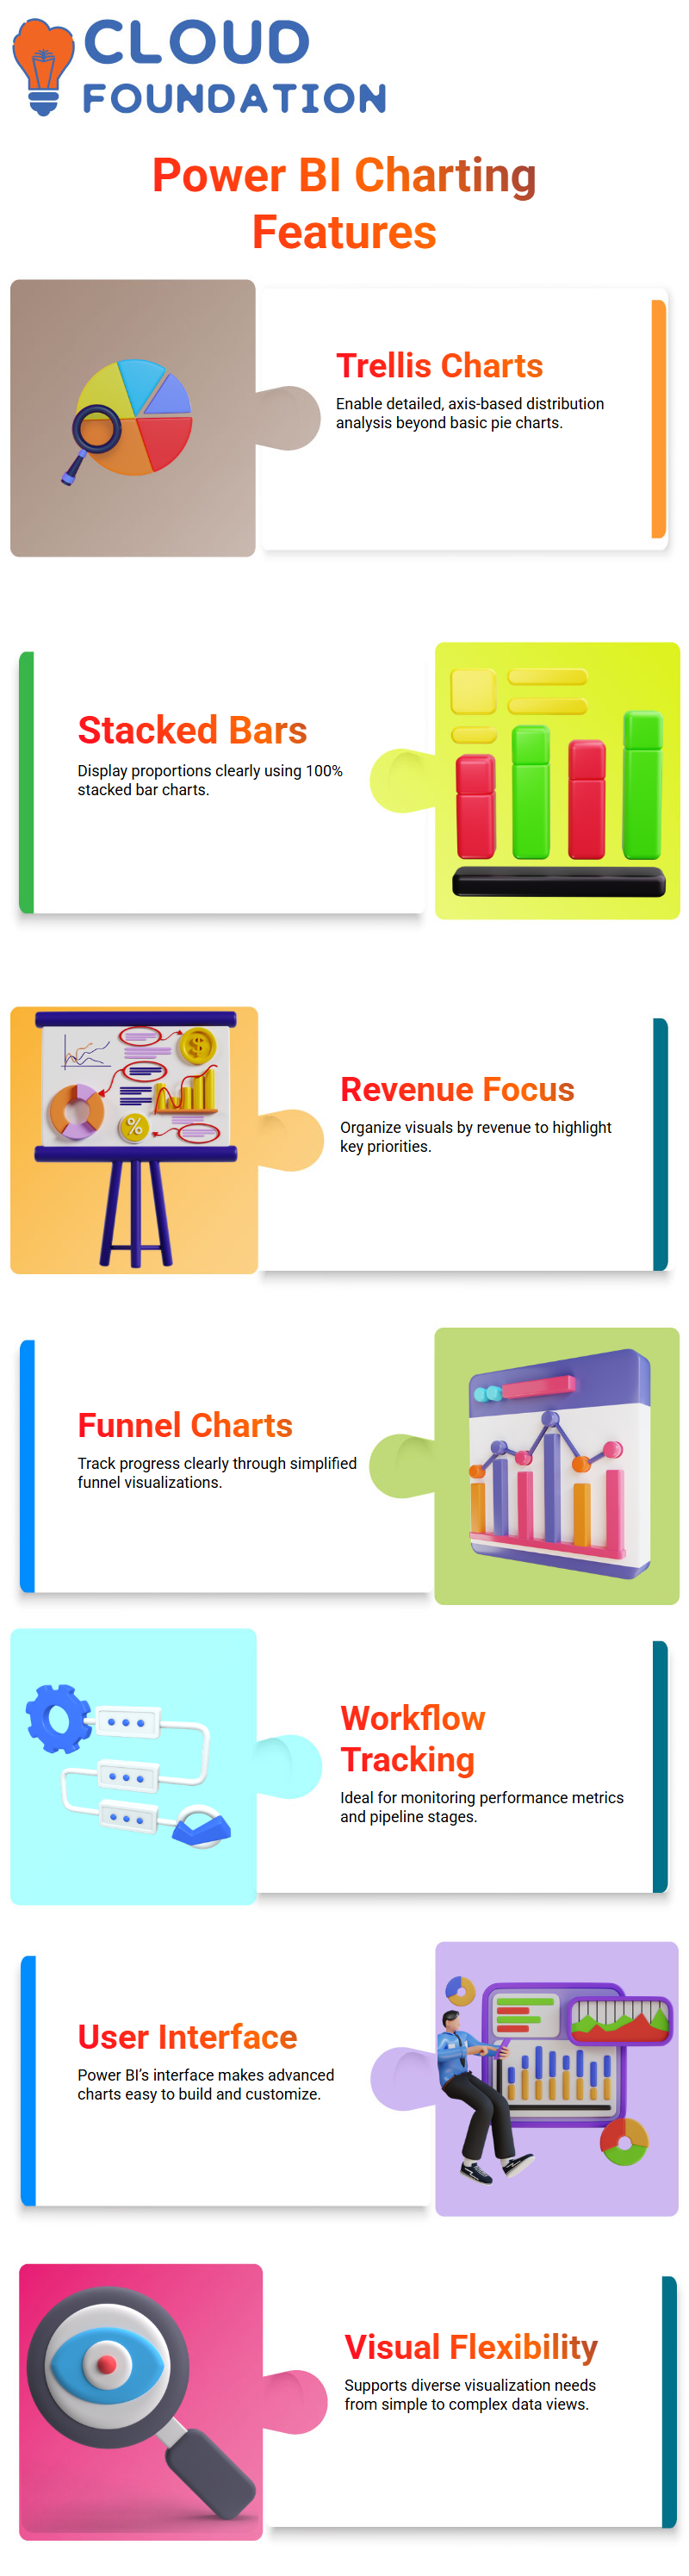
Power BI enables you to organise visualisations by revenue, keeping your focus on what matters.
The Simplicity of Funnel Charts in Power BI
If pie charts prove restrictive, funnel charts from Power BI offer an ideal alternative for visualising data progression clearly, perfect for monitoring workflows and performance metrics.
Power BI’s user-friendly interface enables even complex visualisations, such as funnel charts, to be quickly constructed and customised with ease.
Customising Your Power BI Reports
Customisation techniques in Power BI enable the adjustment of font sizes, header styles, and overall readability. By making elements bold or increasing font size, we ensure our reports remain clear and impactful.
Power BI also enables us to seamlessly manage and filter datasets using sync slicers, eliminating the need for manual copy and pasting across pages for data analysis purposes.
Power BI Customising Data
Power BI makes customising visuals effortless; I experimented with various shades and formats to highlight return rate data.
Power BI enabled me to organise information efficiently and insightfully for further analysis, significantly streamlining my analysis process.
Drill-Through in Power BI
Power BI remembers where you parked your drill-through settings, making it efficient and straightforward to analyse trends.
By focusing on specific areas, such as product performance or bottlenecks, businesses can make informed decisions using Power BI’s analytical capabilities.
Page Navigation with Power BI Buttons
Power BI’s button navigator makes navigating between pages effortless, offering users an enhanced user experience and simplifying report exploration by designing customised navigation buttons to facilitate intuitive report exploration.
 Power BI provides seamless navigation from summary pages to detail pages by setting actions such as ‘Back’ or page navigation, creating an excellent user journey experience.
Power BI Decision Making
Power BI is more than a data analysis tool; it’s a game-changer! Businesses using it to work with return rates, data bars, sorting options, and customised visuals make informed decisions with confidence.
Leveraging Power BI’s features, I ensured that every data point contributed towards developing an in-depth knowledge of performance trends.

Power BI Course Price

Vinitha Indhukuri
Author
Recent Comments