Power BI Tutorial & The Best Power BI Tutorials for Beginners in [2025]
You will acquire an understanding of Power BI features advantages and benefits, by reading this blog.
Power BI
Power BI simplifies data analysis and visualization through its cloud-based architecture. This makes it the perfect tool for businesses of any size.
Drag-and-drop user interface enables the rapid creation of graphical dashboards that may quickly provide insights into your data.
 Power BI stands out in ways other tools cannot, particularly when it comes to data processing, visualization, and predictive analytics.
Power BI was designed with an uncomplicated user interface so it’s designed for ease of use.
This was done to guarantee that everyone from data analysts to decision-makers in organizations could make effective use of the application.
Thanks to its intuitive user interface, users are able to quickly analyze data, generate visualizations and discuss their findings.
Power BI simplifies data visualization. These features include adding custom visuals, designing interactive charts and graphs, as well as setting up custom filters – all included in one package.
With these tools in place, users can quickly and easily generate visualizations.

These features work together to enable users to quickly and easily create custom data representations.

Power BI also provides various capabilities that make collaboration with co-workers simpler.
Sharing is made simple, allowing other users to view and manipulate the same data as the original user.
Additionally, it comes with an application that can be downloaded onto mobile devices to gain access to data, making it much simpler regardless of location.
Power BI provides companies with valuable insights from their data.
Its user-friendly interface offers comprehensive visualizations and statistics, allowing users to quickly collaborate with co-workers, express their viewpoints, and take advantage of Power BI’s adaptable nature by creating personalized visualizations.

Benefits Of Power BI
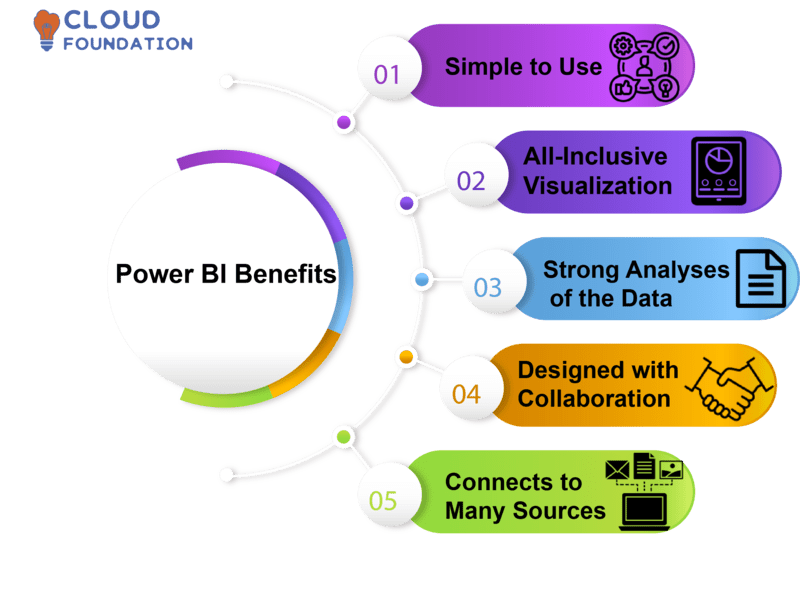 Simple to Use: Power BI was built with ease of use in mind from the beginning, making it ideal for both business professionals and data scientists alike.
With this resource, both can make the most out of it.
All-Inclusive Visualization: Power BI provides its users with a robust selection of tools and configuration options for all-inclusive visualization, enabling them to construct charts, maps, and dashboards with ease.
Furthermore, this provides users with the capacity to interact with data in various ways, such as sorting, drilling down, and hovering over.
Strong Analyses of Data: Power BI offers users access to a powerful suite of functions for data analysis, including AI-driven insights, real-time data processing and predictive modeling.
With Power BI they can gain control over their analytics with confidence.
Designed with Collaboration in Mind: It makes it effortless to collaborate with colleagues.
Users can work together on creating team dashboards, sharing reports, and commenting on visuals.
Additionally, this tool facilitates communication with external sources like Salesforce and Google Analytics.
Connects to Many Sources: Power BI can connect to a wide range of data sources, such as cloud services and databases.
Furthermore, it supports bespoke data connections which allow users to import information from virtually any source.

Advantages of using Power BI
 User-Friendliness: Power BI was designed with ease of use in mind, featuring an intuitive drag-and-drop interface that makes it simple for anyone to start creating visualizations and reports.
Power BI offers a robust library of pre-built templates to expedite data analysis tasks.
Cost Effective: Power BI’s solution is affordable enough for businesses of all sizes to afford.
Individual users have access to a free version, while businesses looking for more storage space and capabilities can take advantage of the paid edition.
Rich Visualizations: An Extensive Collection of Powerful and Flexible Visualizations, in Addition to Data Exploration Tools Users, are able to effectively study vast amounts of data with the assistance of Power BI, which also offers a wide variety of helpful visualizations.
Connectivity: Power BI offers customers the power to connect to hundreds of data sources, both on-premises and cloud-based services.
This makes generating reports and dashboards from any data source a breeze.
Automation: Power BI offers automation options that enable users to construct dashboards and reports automatically.
This guarantees the data is always up-to-date, giving businesses real-time insight into their success.
Easy Teamwork: Power BI makes it effortless for multiple people to collaborate on a single project.
Users are able to exchange dashboards and information with ease, which helps them make decisions more quickly and solve problems more effectively.
Features of Power BI
 Microsoft’s product in the business intelligence and analytics market is known by its brand name: “Power BI.
With this software, users are able to quickly construct dynamic data visualizations, reports, and dashboards with ease. Furthermore, customers are able to perform accurate data analysis in a timely manner with Power BI’s assistance.
Interactive Charts, Graphs, and Maps: With the Power BI program users can generate interactive versions of charts, graphs, and maps.
Data Modeling: Power BI allows users to combine multiple data sources into one workspace, allowing them to construct data models. With this power comes the capacity for analyzing complex data point interactions and uncovering patterns and connections within the data.
Natural Language Query empowers users to ask questions in English and get answers within seconds. Even without programming knowledge, data can be accessed with greater convenience than ever before.
Automation: Power BI’s automated data processing and analysis capabilities enable users to quickly analyze and convert large amounts of information. With its range of features, Power BI not only saves time but also increases overall productivity.
Collaboration: Power BI allows users to collaborate on workspaces and dashboards. Data analysis can be done in teams, with each team evaluating its own data at once.
Access Through Mobile Devices: Users have the power to access their data with the Power BI mobile app on any mobile device of their choosing, ensuring a constant connection to their information so they can make decisions even while they’re out and about.
Power BI Advanced Tutorial
Unlock the full potential of Power BI with our Advanced Tutorial. This course covers a range of topics, such as data modeling, advanced analytics, and data visualization.
 Additionally, it provides comprehensive instructions for creating personalized graphics, configuring dashboards, and using the Power BI API.
This lesson was tailored for individuals with a basic knowledge of Power BI concepts and who wish to take their skill set to the next level.
By following the steps outlined in this course, users will be able to create dashboards, models, and analytics that are more powerful and informative.
Power BI Integration
Power BI is a data visualization solution, widely used by businesses to analyze their information and make conclusions.
Users of Dynamics 365 for Sales can gain better insight into their sales data by integrating Power BI.
With Power BI’s integration, customers’ behavior, sales patterns and other key indicators can be visualized in meaningful ways. Users are able to gain more insight into their customers and make more informed business decisions as a result.
Furthermore, KPIs can be monitored in real-time with Power BI dashboards that allow for effective dashboard creation.
Power BI API Integration
Developers can quickly link their apps to Power BI’s API and take advantage of its impressive data visualization features.
The Power BI REST API enables access to Power BI data, analysis models, embeds visualizations and constructs new visuals with ease.

Developers can incorporate Power BI graphics into web and mobile apps to create stunning visualizations to view data and uncover patterns and insights.
Power BI APIs enable data access, filtering, and aggregation to produce customized dashboards and reports.
Power BI Tool Tutorial
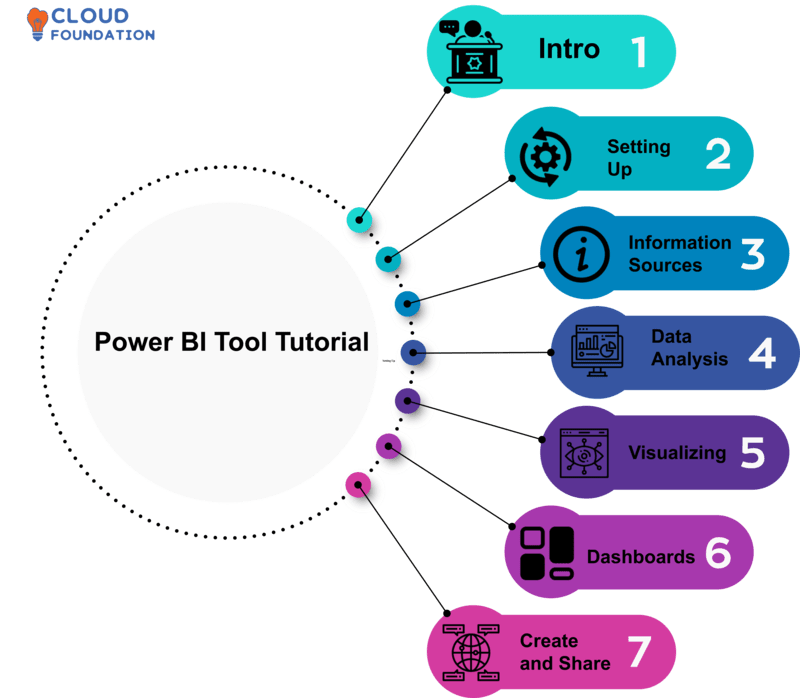
Intro:
Power BI is an indispensable tool for business analytics and reporting. With it, you can quickly analyze and share data with ease – thanks to its intuitive data visualization features. This class will cover everything you need to get started with Power BI.
Setting Up:
Install Power BI first to get started. The installation will launch Power BI automatically.
Information Sources:
Data connection begins with Power BI. This platform supports databases, web services, and Excel – all of which require credentials for access.
Data Analysis:
Evaluate data after joining Power BI’s filters, sorts, and groups.
Visualizing:
Format data and display it visually using Power BI’s maps, charts, and tables. Enhance these visualizations for improved impact.
Dashboards:
Visualize and create a dashboard. Dashboards provide data summaries. Customizing the dashboard adds interest.
Create and Share:
Add Power BI dashboards to your online portfolio so everyone has access to these helpful reports. Everyone can benefit from online dashboards!
Power BI Tutorial for Beginners
Power BI collects, analyses, and presents data. Data visualization improves decision-making.
Start by installing Microsoft Power BI Desktop, which is free.
Power BI has the capacity to link directly with Excel, databases, Facebook, and Twitter – enabling you to easily connect data sources or import files.
Data Analysis
Explore your data with Power BI Desktop once connected. Query Editor filters transform, and cleans data while Data View presents it visually.
Visualize and Report
Power BI allows you to visualize data visually via data charts, graphs, and maps in its Visualizations tab. Report View generates interactive reports as well.

Share Visualizations
Create and distribute reports and visualizations through images, PDFs, or HTML formats. Send these to Power BI users right away for viewing!
Power BI Web Tutorial
With Power BI, an advanced business intelligence software, you can generate dynamic visuals and reports based on your data. Plus, it enables you to share those findings with colleagues, partners, and customers alike.
This course introduces Power BI’s graph-making and data management basics. After I introduce Power BI, we’ll configure your data source, create visualizations, and discuss our findings.

Power BI Software Overview and Demo
Microsoft utilizes Power BI as its data processing and visualization platform. With Power BI, users can efficiently convert and clean data, link to various sources, and create dynamic graphics and reports, which can then be shared with employees, partners, and customers for analysis and insight.
Establish your data source
Before creating visualizations and reports, connect to your data source. Power BI supports Excel, CSV, SQL and more as data sources.
After successfully connecting your data source, you can alter and analyse it with Power BI’s many data cleaning and preparation features.
Showing Results with Results” in Power BI
After linking to and prepping your data, you can start creating visualizations in your software. Power BI’s graphics simplify data analysis.
To make photos more captivating and instructive, annotate or add visuals.
Sharing with Others.
After taking photos, you can easily share them with co-workers, partners and customers. Power BI offers a range of tools to facilitate this process – reports can be uploaded and visuals added to web pages with ease!
Power BI dashboards and visualizations can now be shared with other users, allowing you to collaborate on improving your ideas together.


Shreshtha
Author
Life is a long lesson in humility – Life is either a daring adventure or nothing at all.