What is Power BI and What is Power BI used for?
You will acquire an understanding of what Power BI is, as well as its capabilities and benefits, by reading this blog.
About Power BI
The flexibility of Power BI allows for the creation of dashboards and reports that may access data from several sources, including data that is kept locally as well as data that is saved in the cloud. Power BI, which is hosted in the cloud, can generate interactive dashboards and reports from data received from a variety of different repositories.
It ensures the safety of your data sources and transfers them to the cloud, where they may be processed.
Once the import is complete, you will have access to potent visualizations as well as protected ways for safely sharing them with your peers.
The Power Platform comprises the Power BI Desktop as well as the Power BI Services and Desktop.
Users of Power BI Desktop are able to build reports with complete self-assurance thanks to the availability of these free interactive visualizations and reports on business information.
In order to facilitate the sharing of reports and visualizations, encrypted channels may be used to send those items to other persons or teams.
Users are also given the ability to collaborate on reports and visualizations thanks to these capabilities.
Customers are able to safely share reports and visualizations with one another through the use of the cloud-based service Power BI Services.
Any device with an internet connection can be used by users to access Power BI Services.
Overview, Introduction to Power BI: What Is Power BI?
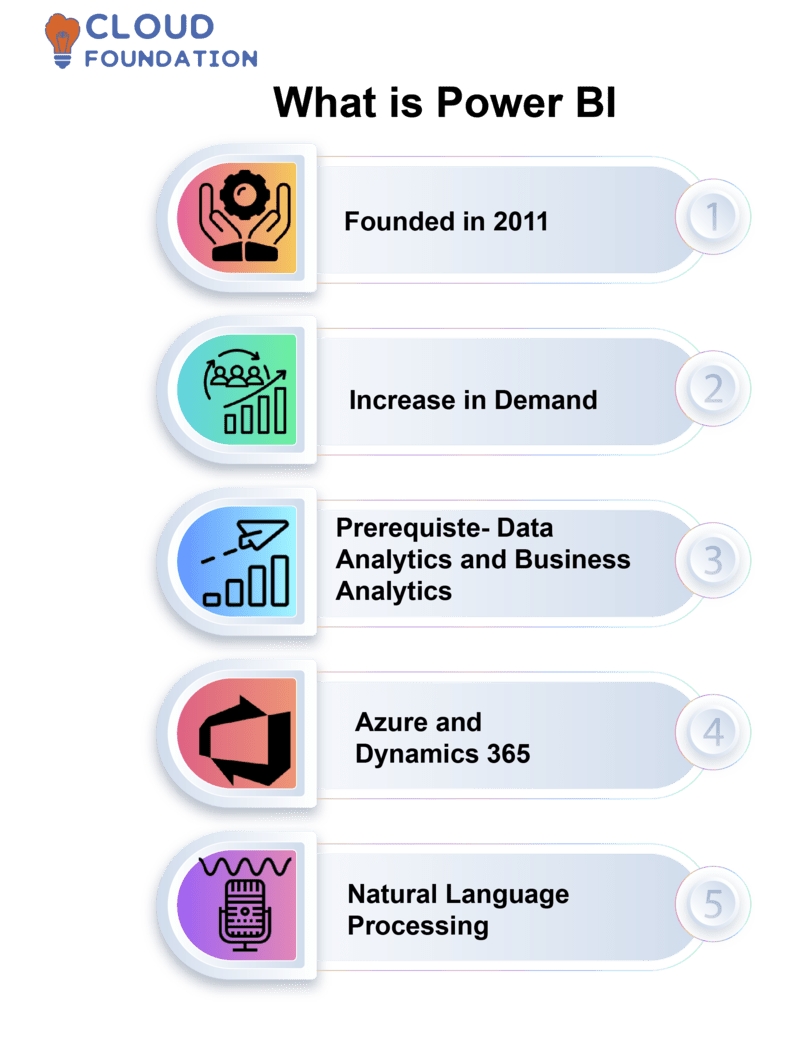
Power BI is a Business Intelligence (BI) tool that is hosted in the cloud and designed for data analysis. It has both visual presentation and analysis capabilities.

It is available for free download on this site, and you can make use of its business intelligence solutions on any device you choose, including data visualization and modeling, data preparation, and data access.
Data visualization is something that Power BI offers through the use of interactive data visualization.
Users of Power BI are able to construct and distribute complete reports and dashboards utilizing Excel, databases, and web apps that are hosted in the cloud.
Users have complete control over this capability to share thanks to its support for intricate reporting structures as well as the availability of public and private sharing choices.
Data may be visualized and interactive charts can be generated with Power BI.
It incorporates data transformation, modeling, visualization, and a natural language query system, in addition to the automation of additional tasks using Excel and PowerApps.
Analytics on an enterprise level is available to companies of any size thanks to Power BI.
It gives customers the ability to swiftly evaluate their data and produce visually stunning infographics that can be shared, which provides businesses with an advantage over their competitors.
Power BI Definition or Define Power BI
Power BI is used to perform data analysis and presentation.
It provides a self-service system for examining information, creating interactive visualizations, and sharing insights through the use of dashboards, which display information gathered from all parts of your organization.
Data sources such as Salesforce and Google Analytics as well as Microsoft Dynamics are supported by Power BI.
Power BI offers insights that enable users to make speedy, well-informed decisions.
Power BI gives companies the ability to perform data analysis and incorporate the insights gained from that analysis into their applications or websites.
Users are able to ask inquiries in plain English and have simple charts, graphs, and reports from a variety of sources made available to them using natural language inquiry.
Also, staff is able to work together and share their thoughts, resulting in the utilization of the same data set by everyone.
What Does Power BI Do and What Is Power BI Used For?
Users are able to build interactive business information reports with the help of Power BI.
Analyse and analyse data coming from a variety of sources, then construct dashboards using visualizations and share your findings.
In addition to this, it enables them to gain insights from their data, collaborate with their co-workers, and make decisions based on those insights more quickly.
Users are able to generate reports and dashboards utilizing interactive visualizations and self-service business intelligence without the assistance of IT or database administrators.
It allows you to share dashboards and data with other people in addition to supporting Excel and SQL Server data, Salesforce data, Google Analytics data, and Twitter data.
It makes it possible to produce interactive reports, dashboards, and visualizations that draw information from a variety of sources.
It helps users swiftly convert information, analyse it, and exchange it with other users in a timely manner.
In turn, Power BI may assist organizations in improving decision-making, acquiring new insights, and enhancing levels of productivity.

How Does Power BI Work?
Business intelligence is provided via Power BI.
It offers data visualization and dashboard creation programs for desktops, the cloud, and mobile devices, while its cloud-based services may store, distribute, and access Microsoft services.

Mobile applications are another potential use for these visualizations.
Connecting to sources, analysing data points, and producing reports and dashboards are the three steps that makeup Power BI’s three additional features: natural language processing (NLP), data discovery, and collaboration.

Why Use Power BI and What are the Benefits of Power BI?
Microsoft Power BI is a set of tools and services that are meant to assist you in getting the most out of your data. Users are given the ability to explore, uncover, and share data stories when using Power BI.
The effectiveness of corporate decisions and overall operations can be improved with Power BI.

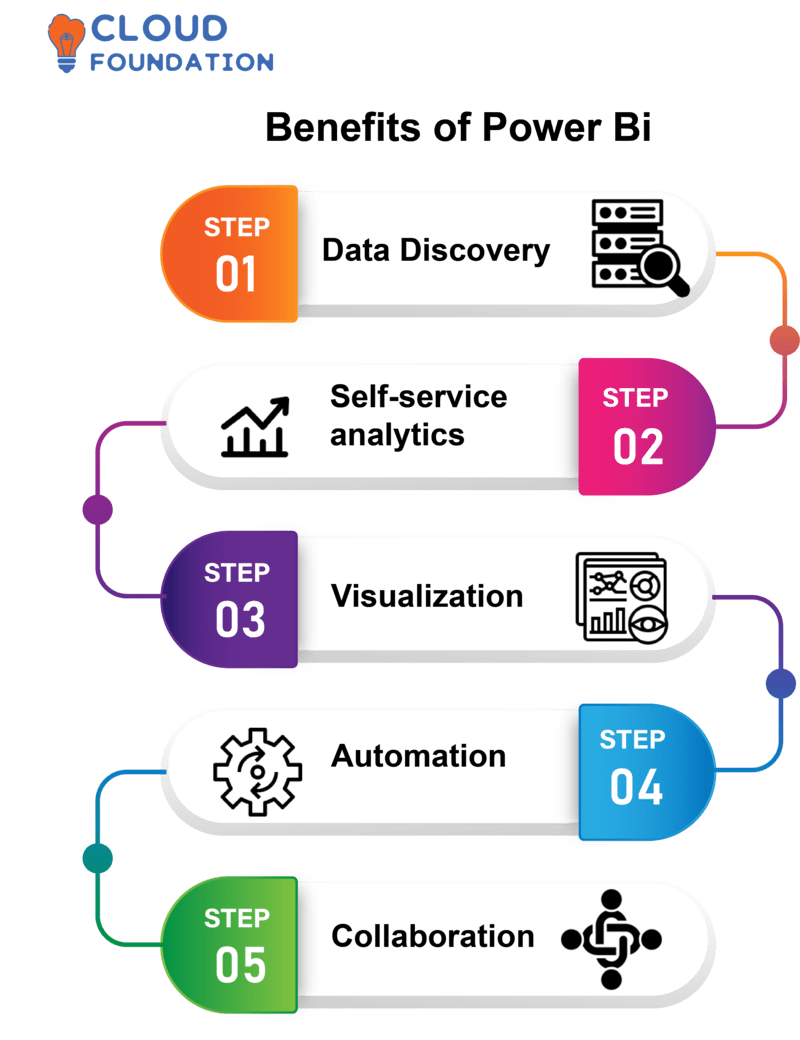
The primary benefits of Power BI include the following:
Data Discovery: Identifying data trends, patterns, and correlations quickly and easily.
Self-service analytics: Data may be analyzed and visualized with no intervention from IT thanks to self-service analytics.
Visualization: In order to clearly express your findings, use eye-catching images.
Automation: Make use of automated data processing to ensure that your records are correct and up to date at all times.
Collaboration: Collaborate with co-workers, customers, and partners to share any insights gleaned through data.
What Are the Advantages of Power BI?
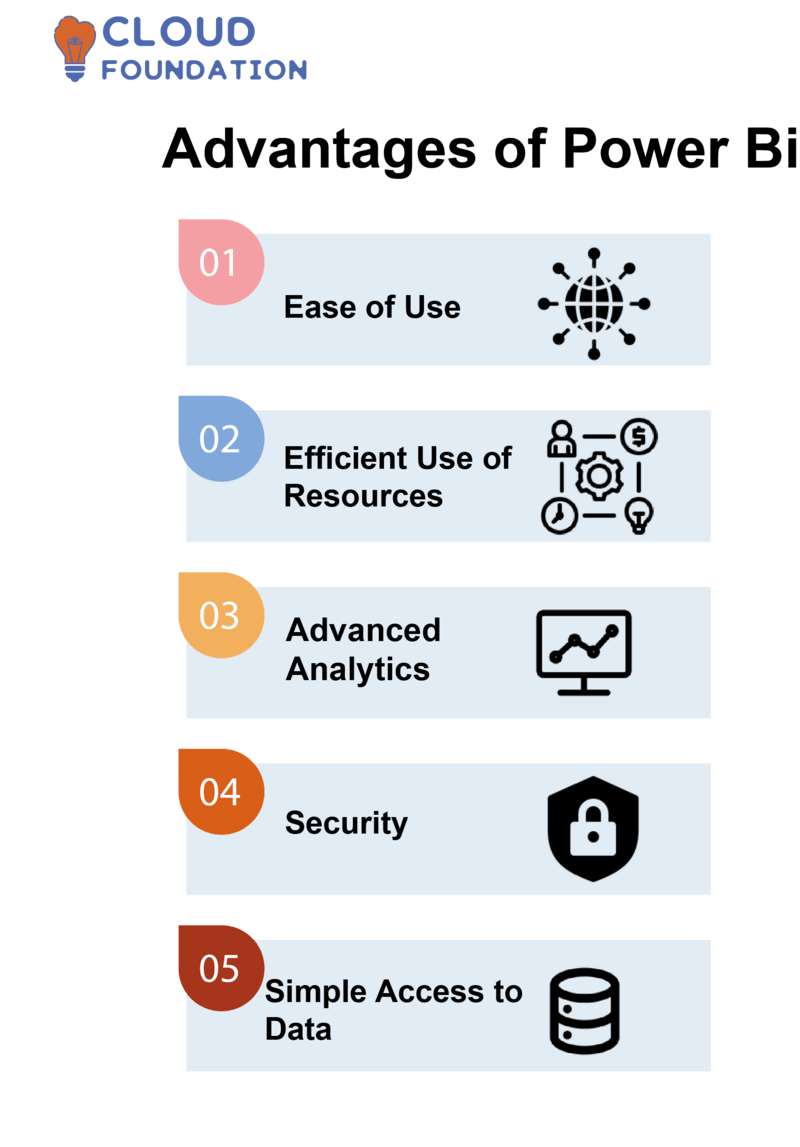 Ease of Use: The user-friendly drag-and-drop interface and visualizations that Power BI provides make data analysis a breeze.
Efficient Use of Resources: Power BI is available in a free edition and also provides low-cost options for larger businesses.
Advanced Analytics: The capabilities of Power BI in the areas of sophisticated data mining, natural language processing, and machine learning deliver deeper insights from your data.
Security: With encryption, authentication, and access management, Power BI protects the data you store with it.
Simple Access to Data: Power BI makes it simple to access data from key sources such as Excel, SQL Server, Oracle, and Salesforce, in addition to offering access to a great deal of other information.
Collaborate with your co-workers, customers, and business partners by discussing the insights gleaned from the data.
What Is Power BI Software and How to Use It?
Power BI’s user-friendly platform, which incorporates Azure, Dynamics 365, and the Power Platform, does away with the requirement that reports and dashboards be generated by IT professionals or database administrators.
While creating dashboards, Power BI does data analysis while also allowing natural language searches. In addition, it links directly to Excel and SQL Server so that results may be shared online or on mobile devices.

Power BI Tool
The business analytics application known as Microsoft Power BI assists firms in locating patterns and trends within their data, as well as in sharing their insights and visualizing the data.

It enables users to collaborate with other experts in their field, supports the production of interactive dashboards and reports, and provides derived insights that are derived from the data.
Using Power BI, organizations are able to better their decision-making processes, obtain greater insights, and accelerate their business performance.
 Rich dashboards that can be accessed from any device provide instant insight and solutions. These characteristics were taken into consideration during the design and development of Power BI Features.
By keeping up with the latest news and advances in your sector, you can maintain an advantage over your rivals.
Power BI Features
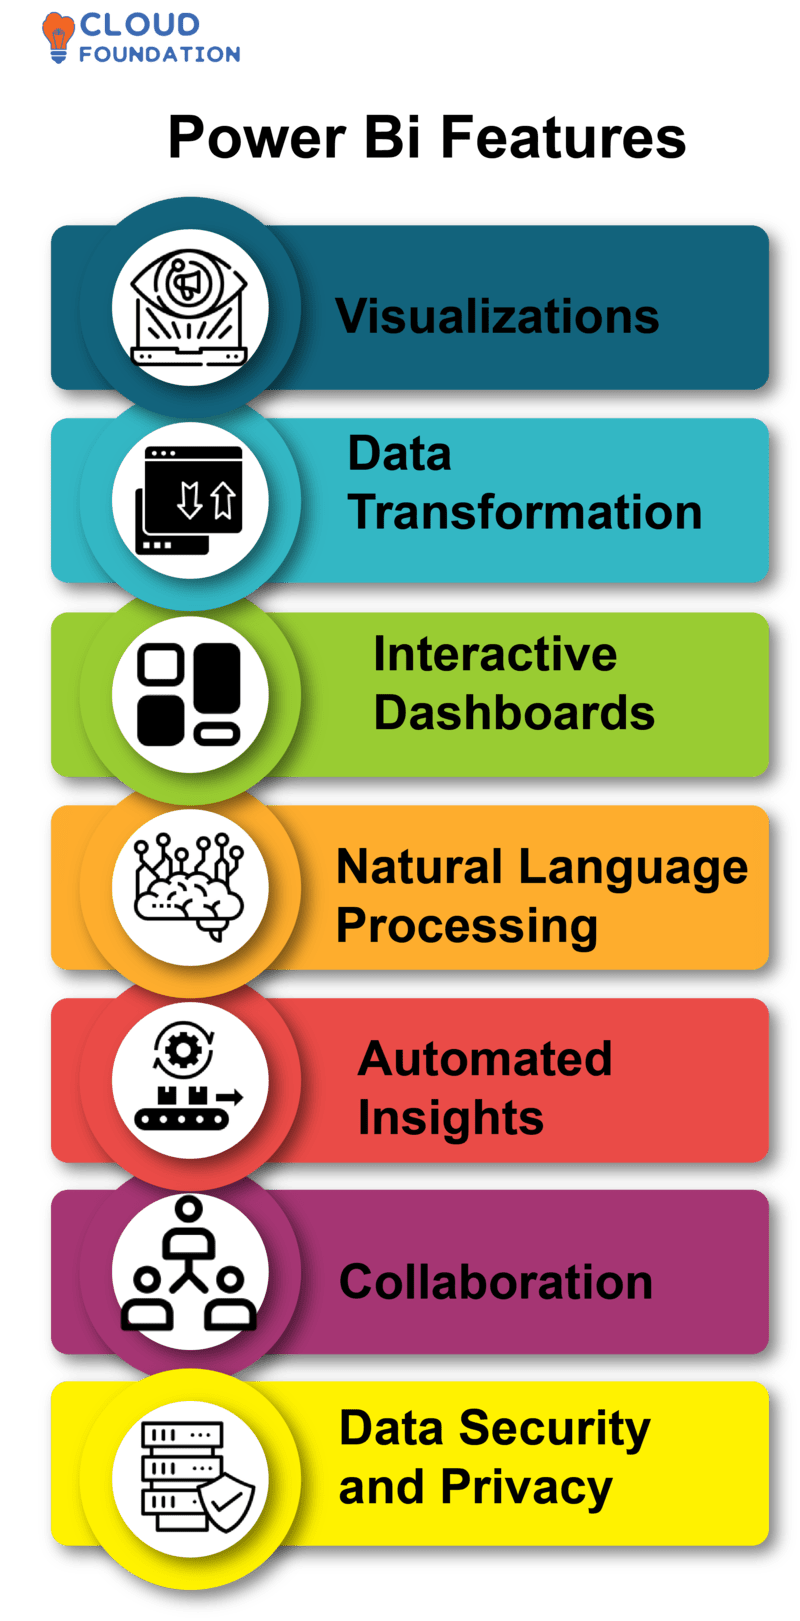
Visualizations: Power BI provides a representation of data in the form of interactive charts, tables, and gauges.
Data Transformation: Power BI helps users transform raw data into actionable reports that they may then share with other people. Power Query, Pivot, and View are the three components that manipulate the data.
Interactive Dashboards: Data is visualized by means of interactive dashboards that are powered by Power BI.
Natural Language Processing (NLP): NLP enables users to ask queries about their data in a natural language and obtain visualizations as replies.
Automated Insights: Power BI performs data analysis and creates automated insights to assist users in recognizing trends in their data and gaining a better knowledge of it. Automated insights based on predictive analytics make it possible for people to make well-informed choices.
Collaboration: Power BI includes options for real-time data sharing as well as collaboration, which makes it possible for dashboards to be commented on or shared in real-time.
Data Security and Privacy: Power BI helps customers maintain control over their data by providing access control, while also protecting user data with its advanced analytics tools.
What Are the Best Ways to Learn Power BI?

CloudFoundation offers an excellent framework for getting the most out of Power Bi basics, which makes it simple for novice users to rapidly advance their skills.
It assists in making use of your existing understanding of the Power BI online tutorial videos that are presented. They provide the course so that new individuals who have an interest in learning more about it may do so via the medium of this Power BI course.
You may learn more about it with the aid of the various training videos that are accessible to you, and you can watch them anytime you choose. You may be able to discover more about the issue with the assistance of the Power BI blog.


Shreshtha
Author