Marketing Cloud Intelligence Data Classification Tutorial
Making Data Classification Easy with Datorama
Datorama’s intelligent platform makes data organisation seamless for me, and I no longer need to write code to organise information into relevant buckets.
Datorama’s data classification features enable me to easily group and analyse my data in ways that make sense to those I present it to.
For instance, if there’s a column called ‘Placement Names’ within my dataset, using these features would enable me to do just that with ease.
Datorama makes consolidating these tasks into separate dimensions effortless, and I publish data year by year without breaking a sweat.
How does Datorama accomplish this feat?
After uploading my classification file using Datorama’s user-friendly interface, I name and select my classification rule to test (let’s call it ‘tested’), along with any dimension I wish to classify (for example, a 2-dimensional classification).
Datorama’s intelligent design automatically recognises key columns; otherwise, you can choose and set one yourself.
Datorama stands out by handling exact matches perfectly well. It truly amazes me how it handles them so seamlessly.
Datorama makes classification easy. For example, when my key column matches up perfectly with the dimension column, Datorama aligns them perfectly.
In instances where the dimension contains a key, Datorama remains flexible enough to handle any classification challenge.
It offers brilliant visibility as you search your catalogues or shelves.
Datorama makes updating my classification file easy: I can edit directly within their platform.
Should a data point require classification under programmatic categories, Datorama allows me to do that without needing to reupload an entire file.
Default strings provide me with an effective means of managing unclassified data, making sure nothing falls through the cracks.
Using Datorama to Present Data Effectively
Presenting data to various audiences can be daunting, but Datorama made my task simpler.
By consolidating publishers into categories such as print, web and television, my charts become less dense and simpler to comprehend.
As I share results with CEOS or CXOS, they see an overall picture of each category’s performance rather than becoming bogged down with publisher details.
Consider the following scenario: A CXO wants to understand how their print investment has performed after investing millions of dollars.
Datorama can help provide aggregate performance metrics.
Datorama makes strategic decision-making impactful and straightforward.
I can confidently pitch insights that resonate with account managers and business leaders alike.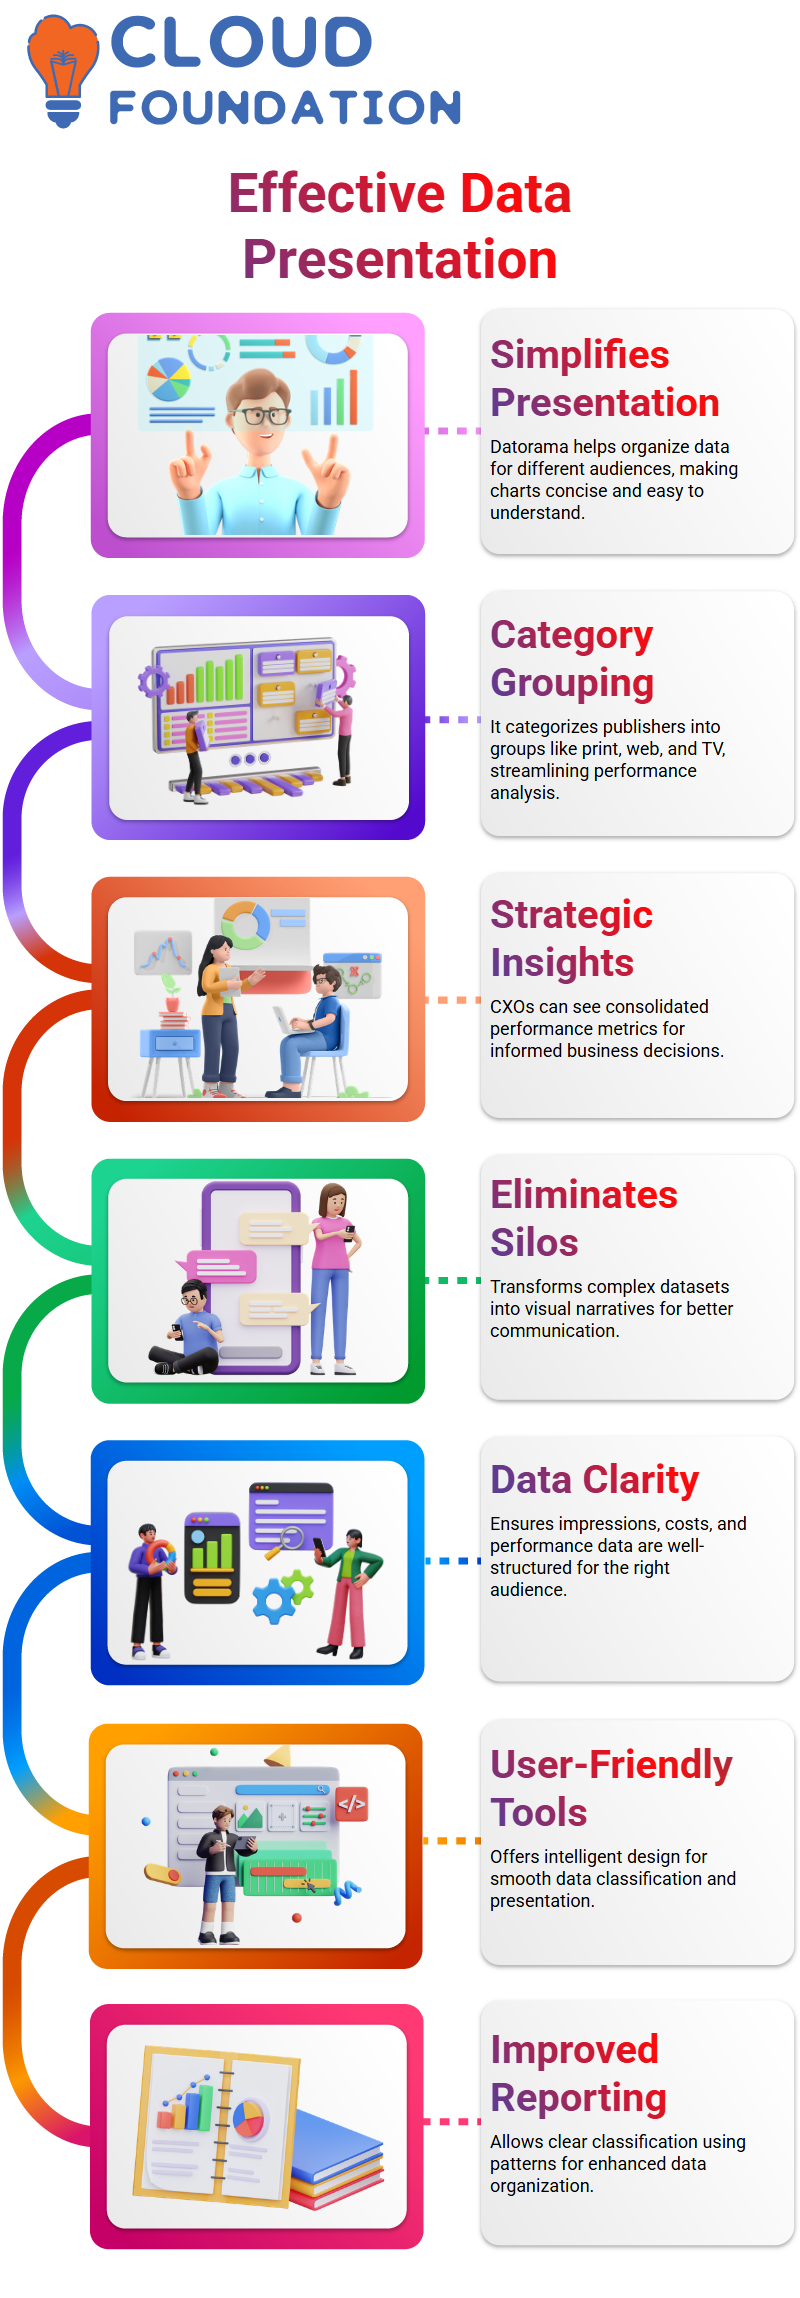
Gone are the days of data presented as separate silos.
Datorama helps me categorise publishers into meaningful groups, translating complex datasets into visual narratives that I can communicate effectively to my target audiences.
From impressions, costs, and performance analyses, Datorama ensures my data speaks the appropriate language.
Datorama makes plotting graphs or sharing findings a snap with its intuitive design and user-friendly tools for data classification and presentation, helping me take my analysis to new heights.
That is why I trust Datorama to take my data analysis to new levels.
Using Datorama for Data Classification
Welcome to Datorama and data organisation.
Imagine being tasked with simplifying data. To accomplish this, a classified column requires classification using Datorama tools, making the process quick and painless. Once complete, you’ll be on your way towards improving reporting.
Harmonisation Centre in Datorama
After classifications, Datorama provides its next service – Harmonisation Centre.
Here, you’ll be able to store classifications and patterns as you seek harmonisation solutions.
An impressive feature is that Datorama provides a holistic perspective of your efforts to harmonise.
Datorama provides clear feedback regarding what needs attention and offers suggestions to keep things on track.
Starting with three patterns, Datorama allows media and campaign names to align perfectly.
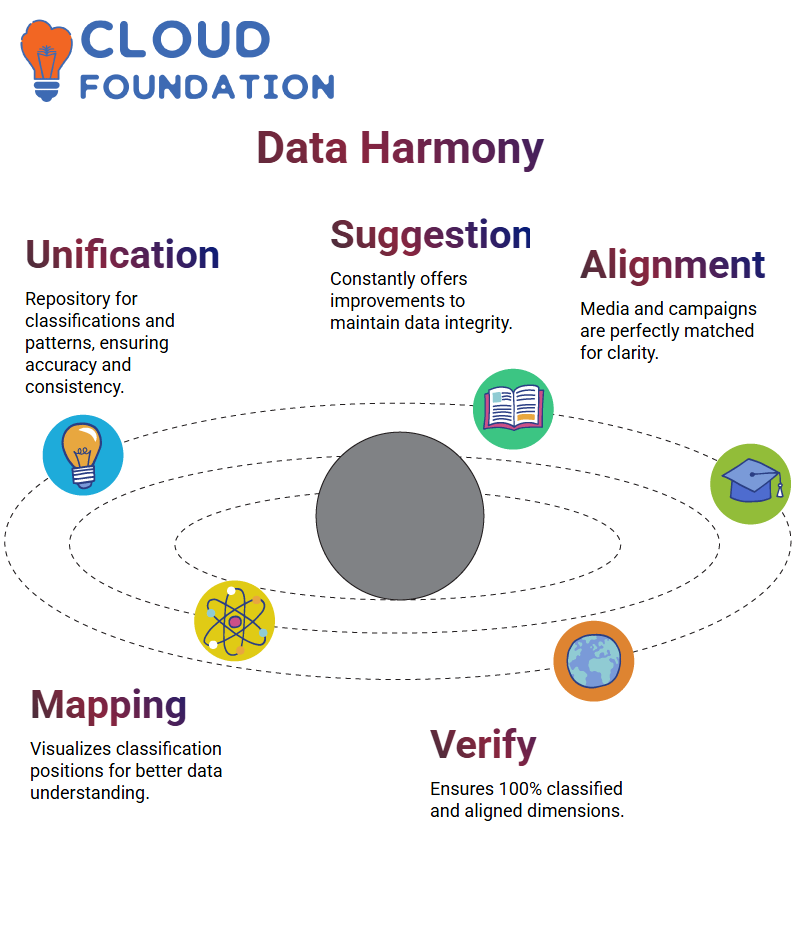
Furthermore, its Mapping Visualizer shows classification positions for media and campaign patterns.
Dimension Harmoniser creates dimensions harmonised around these patterns for total data clarity.
Visualising Data Patterns with Datorama
At Datorama, campaign names and media can be beautifully visualised by pattern using its visualisation tool.
With Datorama’s data classification solutions, you can be assured that 100% of dimensions are classified and verified, demonstrating excellent alignment and harmony.
Data Validation with Datorama
Have you encountered clients who only want specific data?
Datorama’s validation feature comes to the rescue with the addition of validation sheets, which allow you to display only particular pieces, such as local publishers or portals.
Uniform Data Formatting in Datorama
Consistency is of the utmost importance, and Datorama excels at this feature as well.
By selecting “Convert Case,” you can effortlessly standardise data across lowercase, uppercase or proper case styles without creating discrepancies in the presentation of information.
Ensure uniform data presentation to eliminate discrepancies.
Enhanced Reporting with Datorama
Datorama makes exploring harmonised dimensions and patterns exciting – you can discover creation times, rule names and validate data explicitly tailored to your requirements with just a click.
Navigating and managing classifications effectively saves both time and energy during reporting processes—a truly valuable experience.

Datorama Training
Understanding Datorama Re-emergence
Have you been confused as to what re-emergence means in Datorama?
Its Re-emergence refers to creating reports that export data previously loaded from multiple sources into your workspace, harmonise it, and then reload it as new streams into Datorama as new data streams.
The Role of Harmonised Data Streams in Datorama
Reemerging can be seen as managing 100 data streams simultaneously in Datorama.
They could come from similar or completely disparate sources – take, for instance, Facebook data: Let’s say 100 streams contain it.
Harmonising them using calculated dimensions or other tools. After that, visualise it using Datorama’s built-in tools.
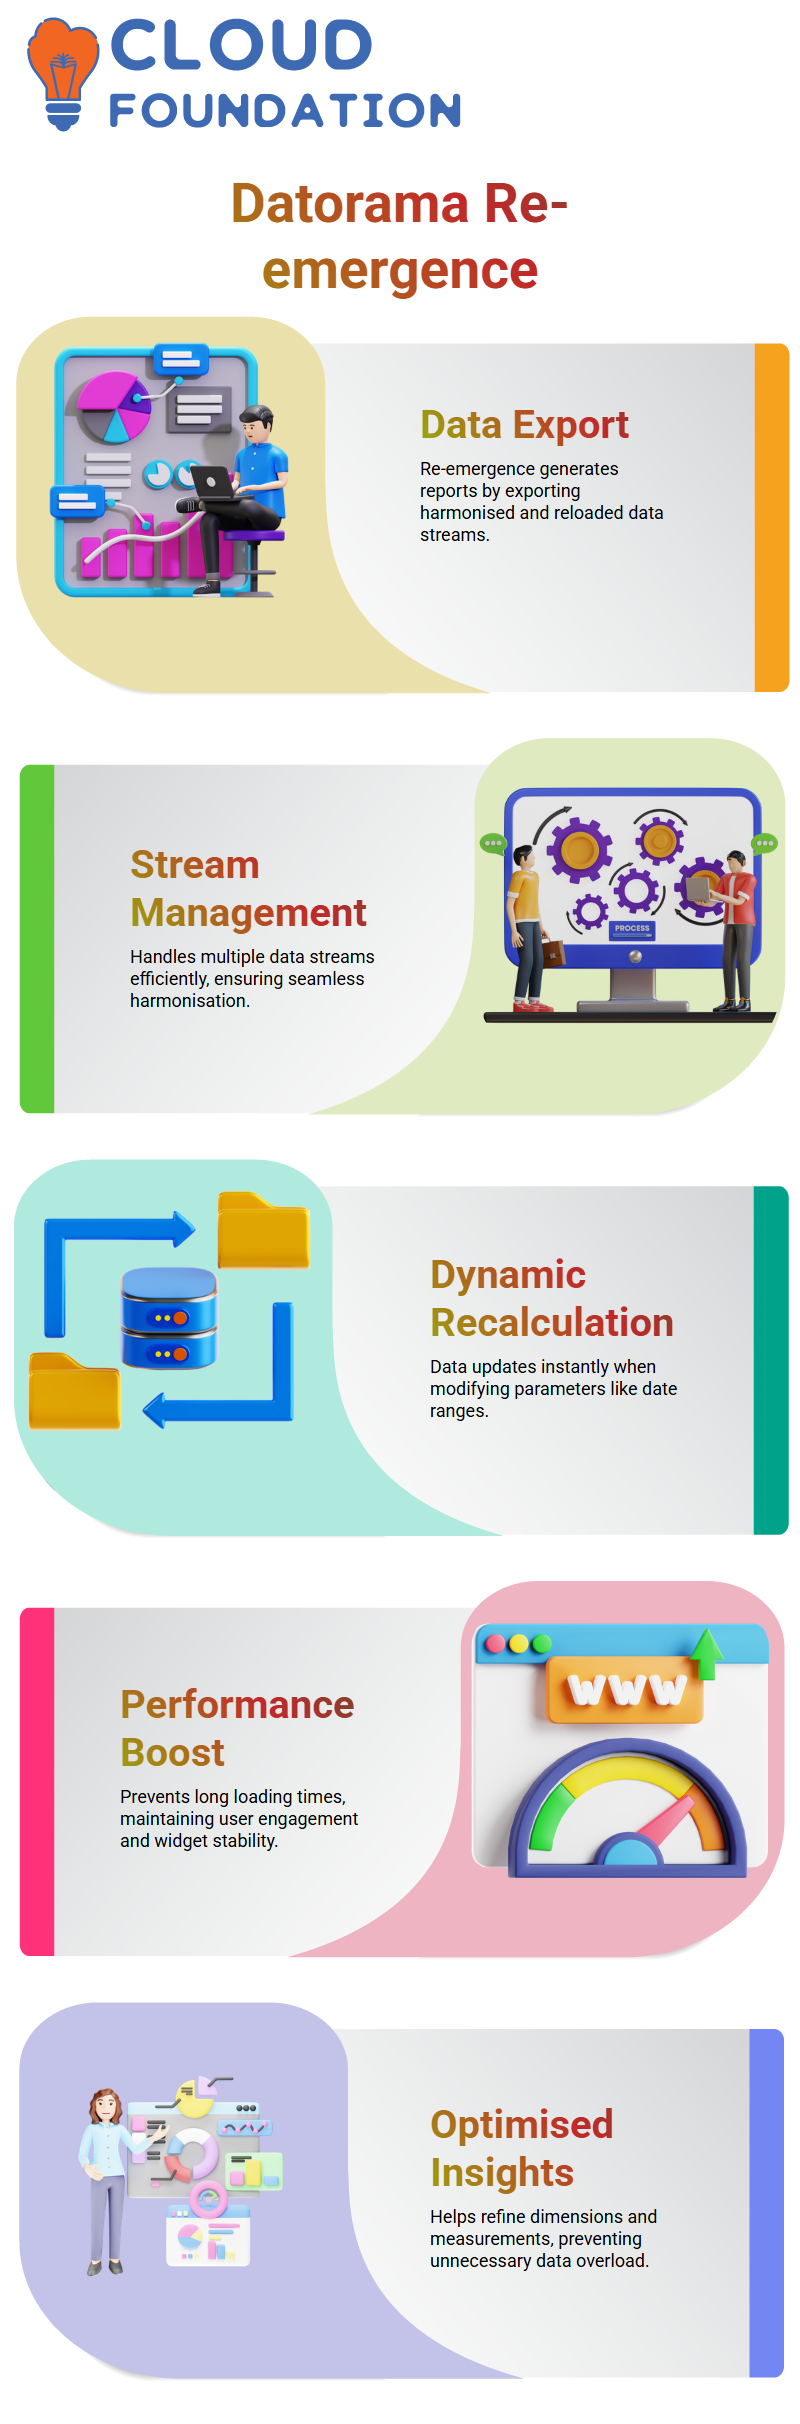
Once your date range changes to June 21st versus 22nd, for instance, all harmonisation calculations start recalculating immediately on the fly.
Re-emergence in Datorama functions like an onboard compiler, sequentially processing your data to offer solutions against slow load times, user disinterest, and potential widget crashes.
Without it, long loading times could occur, which could annoy end-users and cause unexpected issues with widgets.
Why Datorama Re-emergence Matters
Imagine working with data from not just Facebook, but also other channels, including display, search, social, and programmatic ads.
Datorama provides access to both planned and actual data, making re-emergence your secret weapon for handling both planned and actual information.
Helps you determine and finalise dimensions and measurements you require without overburdening yourself with excess data.
Optimising Data Streams in Datorama
Here’s the thing: many individuals tend to access all available data sources, such as Google Ads or Display & Video 360 (DV360), but only utilise a portion of it for analysis.
Why make your file unnecessarily data-heavy?
With Datorama’s approach of working smarter, not harder, the Platform encourages you to utilise historical data as needed without adding extra weight to current reports.
How Datorama Simplifies Reporting
Re-emergence in Datorama goes beyond simply managing data – it also ensures a smooth workflow in the long run.
By extracting key dimensions and metrics from existing streams and feeding them back as new streams, resurfacing ensures everything aligns perfectly.
Dimensions take centre stage here; their measurements are aligned seamlessly with those harmonised dimensions, ensuring seamless measurements that match perfectly.
Re-emergence as a Tool for Datorama Efficiency
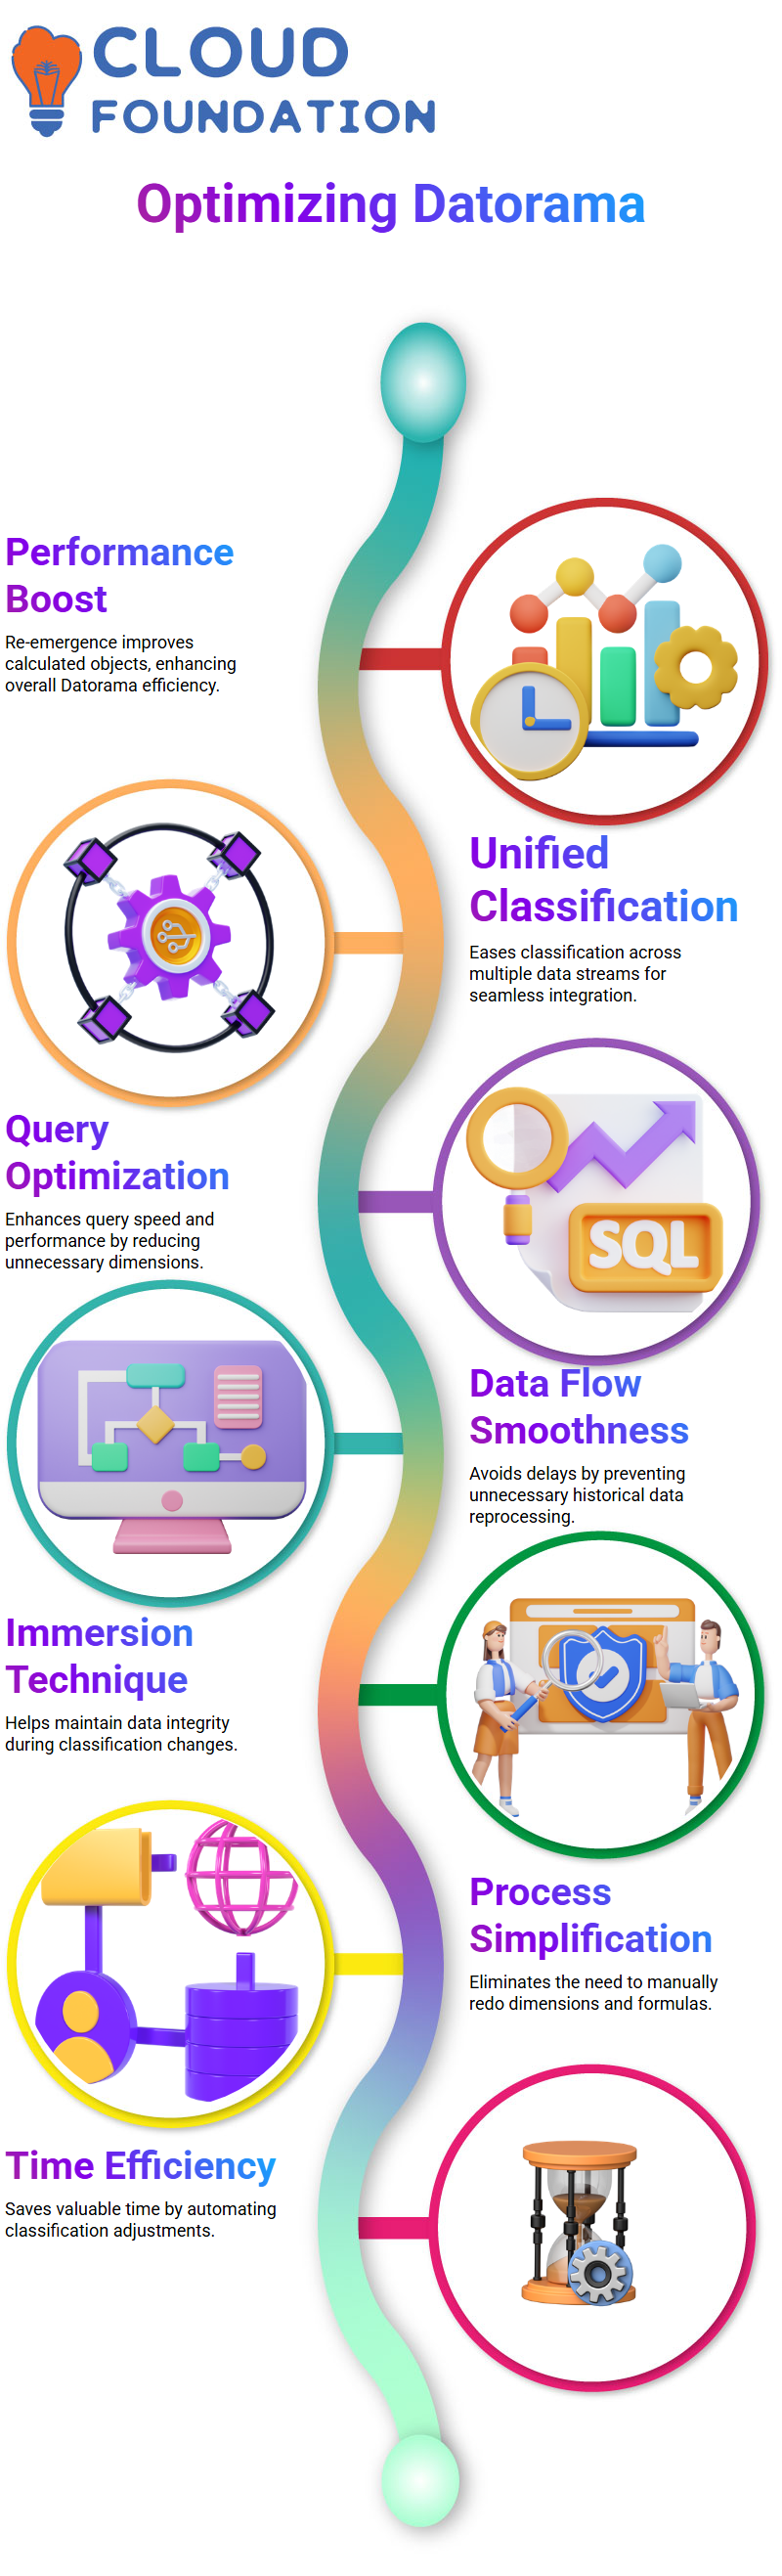
Re-emergence provides a solution to performance issues when working with calculated objects in Datorama, enabling seamless classification across multiple data streams while significantly improving query performance.
Datorama users like yourself can work more effectively by eliminating unnecessary dimensions and metrics, allowing them to work efficiently with Datorama.
Understanding Datorama’s Role in Data Classification
As part of working with Datorama, it’s natural to want your data processing to go as smoothly as possible.
Immersion techniques offer a highly effective solution, and we don’t reprocess historical data whenever the classification changes.
I recommend this practice to reduce unnecessary roadblocks during data processing.
Datorama simplifies life by eliminating the need to reprocess historical data repeatedly.
Imagine having completed the initial harmonisations for a classification sheet, where everything now seems fine. Datorama eliminates that tedious step.
However, should your classification sheet change tomorrow, recalculating all dimensions, formulae, and patterns can become time-consuming.
That’s where Datorama comes in to simplify this entire process and save you valuable time.
Datorama’s Approach to Handling Data Streams
Datorama truly excels when used to manage complex data streams requiring uniform classifications.
Suppose you have ever struggled to map formulas and calculated dimensions across hundreds of data streams.
In that case, Datorama makes the challenge of classifying dimensions more manageable by effectively classifying and harmonising your dimensions.
Imagine managing thousands of data streams while also needing to categorise specific dimensions, such as campaign names, dates, or brand details.
Datorama enables you to effortlessly manage these classifications without repetitive tasks or losing sight of patterns, allowing you to focus on what truly matters.
Improving Performance with Datorama’s Reemergent Techniques
Have you encountered performance issues when using calculated measurements and dimensions in your widgets?
Datorama’s newly emerging techniques make an enormous, impactful difference here.
Datorama provides native measurements that dramatically boost dashboard performance, such as having two Facebook streams labelled Facebook 1 and Facebook 2, instead of needing to calculate them on the fly.
For example, consider having two streams that track these two social networking giants, each could contain its measurements that you can add to Datorama for enhanced dashboard management.
For instance, consider having two separate Facebook data streams, such as “Facebook 1” and “Facebook 2.”
With Datorama’s classification features, classifying media names, campaign names and placement sizes is made simpler while remaining accurate.
Our goal is to streamline workflow while upholding precision.

Datorama Online Training
Understanding Media Data Through Datorama
Have you ever found it challenging to organise and categorise data efficiently into meaningful dimensions?
I can offer valuable insights on utilising Datorama to manage media data streams efficiently.
Datorama makes extracting data attributes simpler than you think: media keys, campaign names, and impressions are among them.
I can simplify things for you. Imagine working with hundreds of data streams.
Datorama allows us to easily categorise campaign names and media attributes into easily manageable dimensions, starting by extracting media keys from reports.
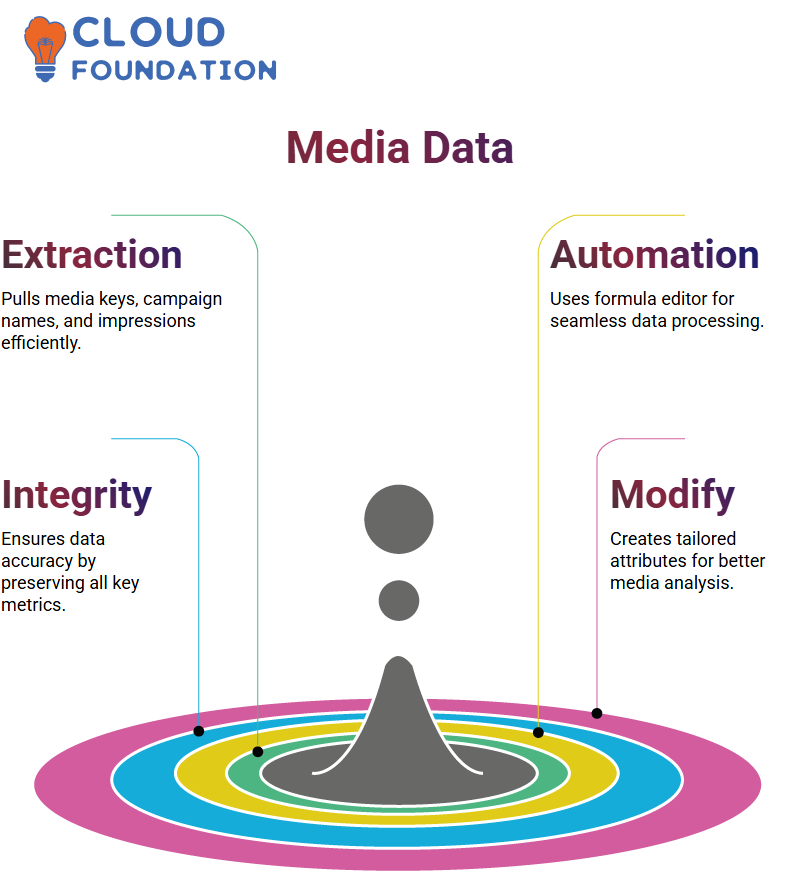
Datorama takes measures to safeguard data integrity by extracting impressions and clicks alongside their relevant dimensions, thus mitigating any risk of lost information by pulling measurements for all dimensions of performance measurement.
Data Extraction Simplified with Datorama
Datorama makes magic with data: we can utilise its capabilities to extract columns like media keys and campaign names and classify them as attributes, using tools like the extract function for precise positional identification within data streams.
Datorama makes working with its intuitive formula editor effortless, offering multiple data streams a single solution and creating custom attributes by methodically extracting information.
By specifying delimiter positions in the formula editor, Datorama simplifies the process of working significantly.
Creating Parent-Child Relationships with Datorama
Let’s dive deeper into relationships. Datorama helps us map data streams with parent-child connections.
This ensures measurements and dimensions are linked accordingly for optimal classification purposes.
Datorama excels at logically inheriting classifications between native and re-emergent data streams, making its structure invaluable for organising and validating rows more efficiently.
Datorama’s system helps keep everything neat and consolidated for data professionals, and it’s truly an invaluable asset.
Understanding Data Streams in Datorama
As Datorama users are aware, efficiently managing data streams is crucial for effective data management.
A key concept in Datorama is inheritance, where child streams inherit properties from their parent data streams, simplifying classification and ensuring consistency across datasets.
As part of my setup, I use Facebook Reemergent as the parent stream for several other streams to ensure media attributes remain uniform across their lifespans.
One of Datorama’s most significant assets lies in its ability to handle such hierarchical relationships effectively.
Making the Most of Datorama’s Classification Capabilities
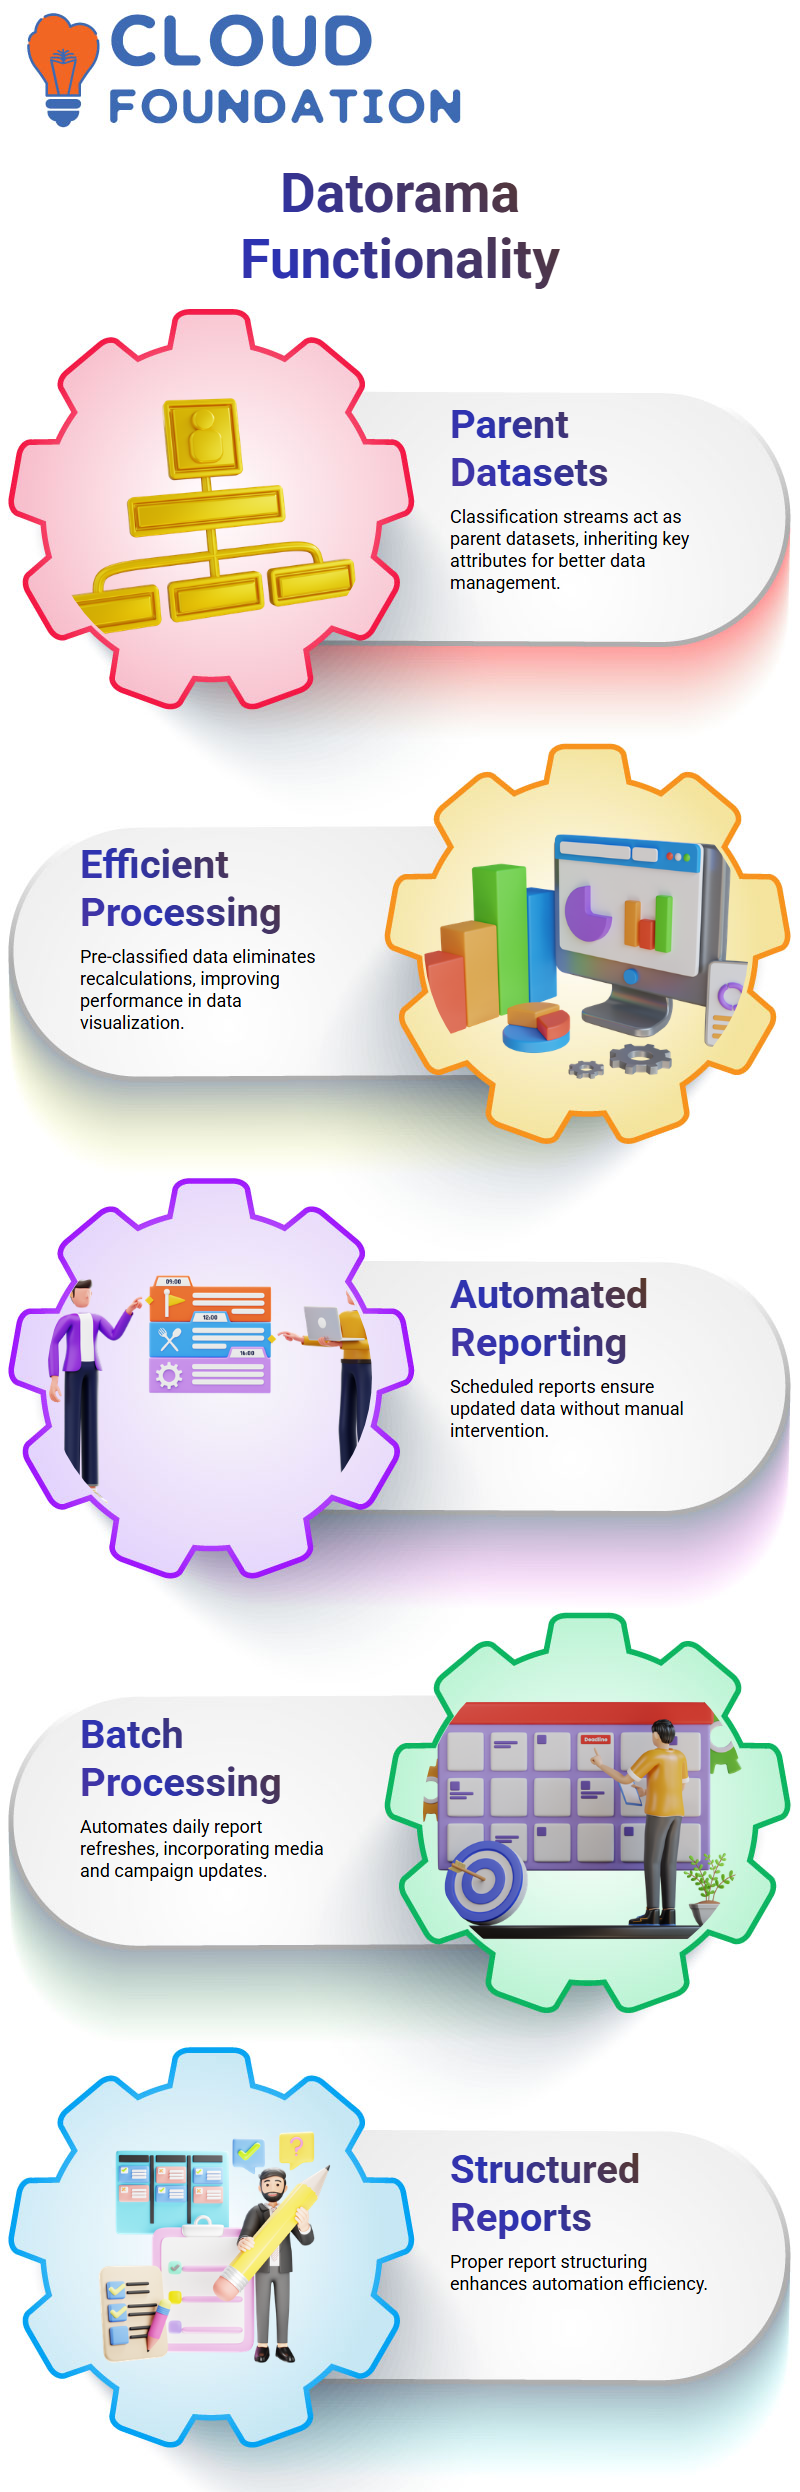
Datorama enables classification streams to serve as parent datasets, ensuring that key attributes, such as media dimensions and campaign details, are effectively passed along from generation to generation.
Datorama simplifies data visualisation by eliminating unnecessary calculations through preclassified placeholders and other forms of pre-calculated information.
Datorama stands out among competitors by efficiently extracting data from parent streams without recreating everything on the fly, automating reports to enhance performance significantly and saving users valuable time and energy.
This automation substantially reduces performance costs by creating more organised reports with reduced complexity.
Optimising Reporting and Scheduling in Datorama
Schedule reports in Datorama to keep your data up to date.
By automating batch processing, reports can be automatically refreshed daily with any updated media attribute information or campaign details.
Datorama’s scheduling tools make managing large datasets manageable.
When setting up scheduled reports, I define their frequency in Datorama, whether that be daily, weekly, or at other suitable intervals that suit me best.
With automation handling this task, my reports remain up-to-date, eliminating the need for manual intervention.
Handling Calculated Dimensions in Datorama
Datorama can make managing calculated dimensions challenging, but using a practical approach will often solve many issues.
When analysts create multiple layers of calculated dimensions, they risk creating performance bottlenecks, which compromise overall system functionality.
Instead of disrupting processes, Datorama allows us to work within its framework to optimise calculations.
Extracting calculated dimensions and incorporating them into classification streams streamlines data handling.
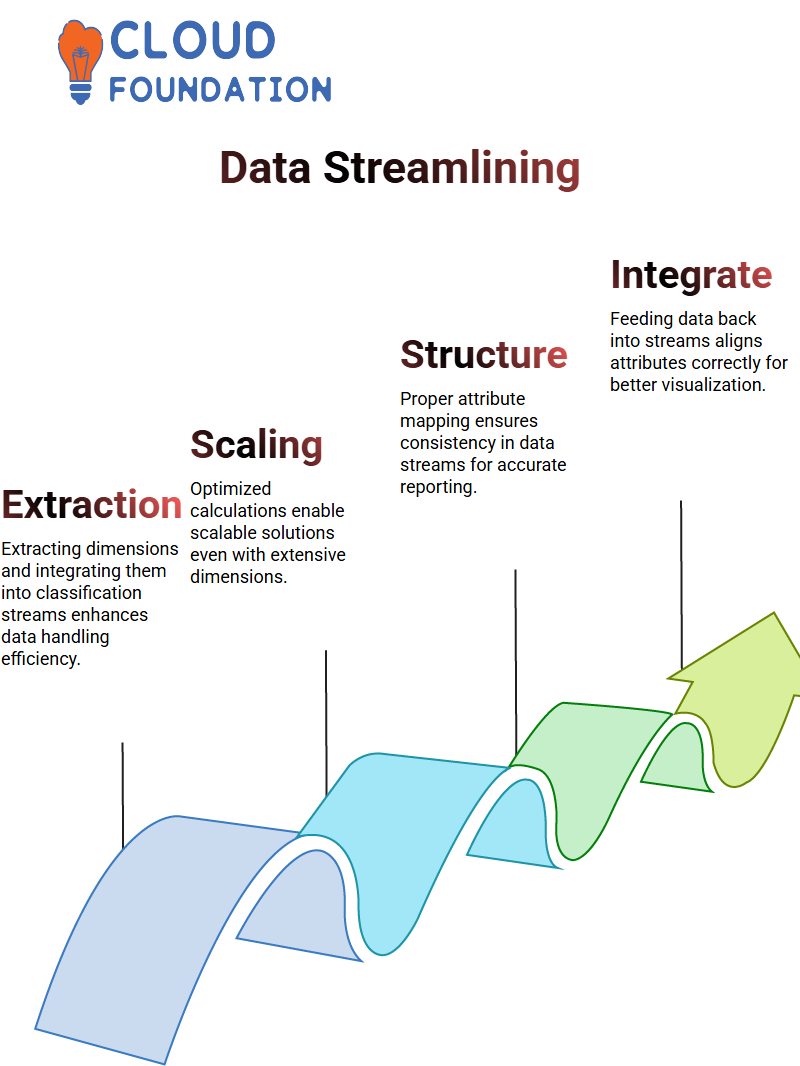
This approach enables the development of scalable solutions, even when working with hundreds of dimensions.
Enhancing Data Streams in Datorama
Structuring data streams with appropriate attributes is crucial when using Datorama to maintain consistency in media attributes, campaign classifications, and custom dimensions across media streams and campaigns.
By feeding data back into Datorama streams, it ensures that all attributes are aligned correctly and visible on the screen.
This setup enhances reporting accuracy while simplifying visualisation workflows.

Datorama Course Price

Sai Susmitha
Author