Workday P2P Training On Custom Report Creation Using Scar
Building Custom Financial Reports with Scar in Workday
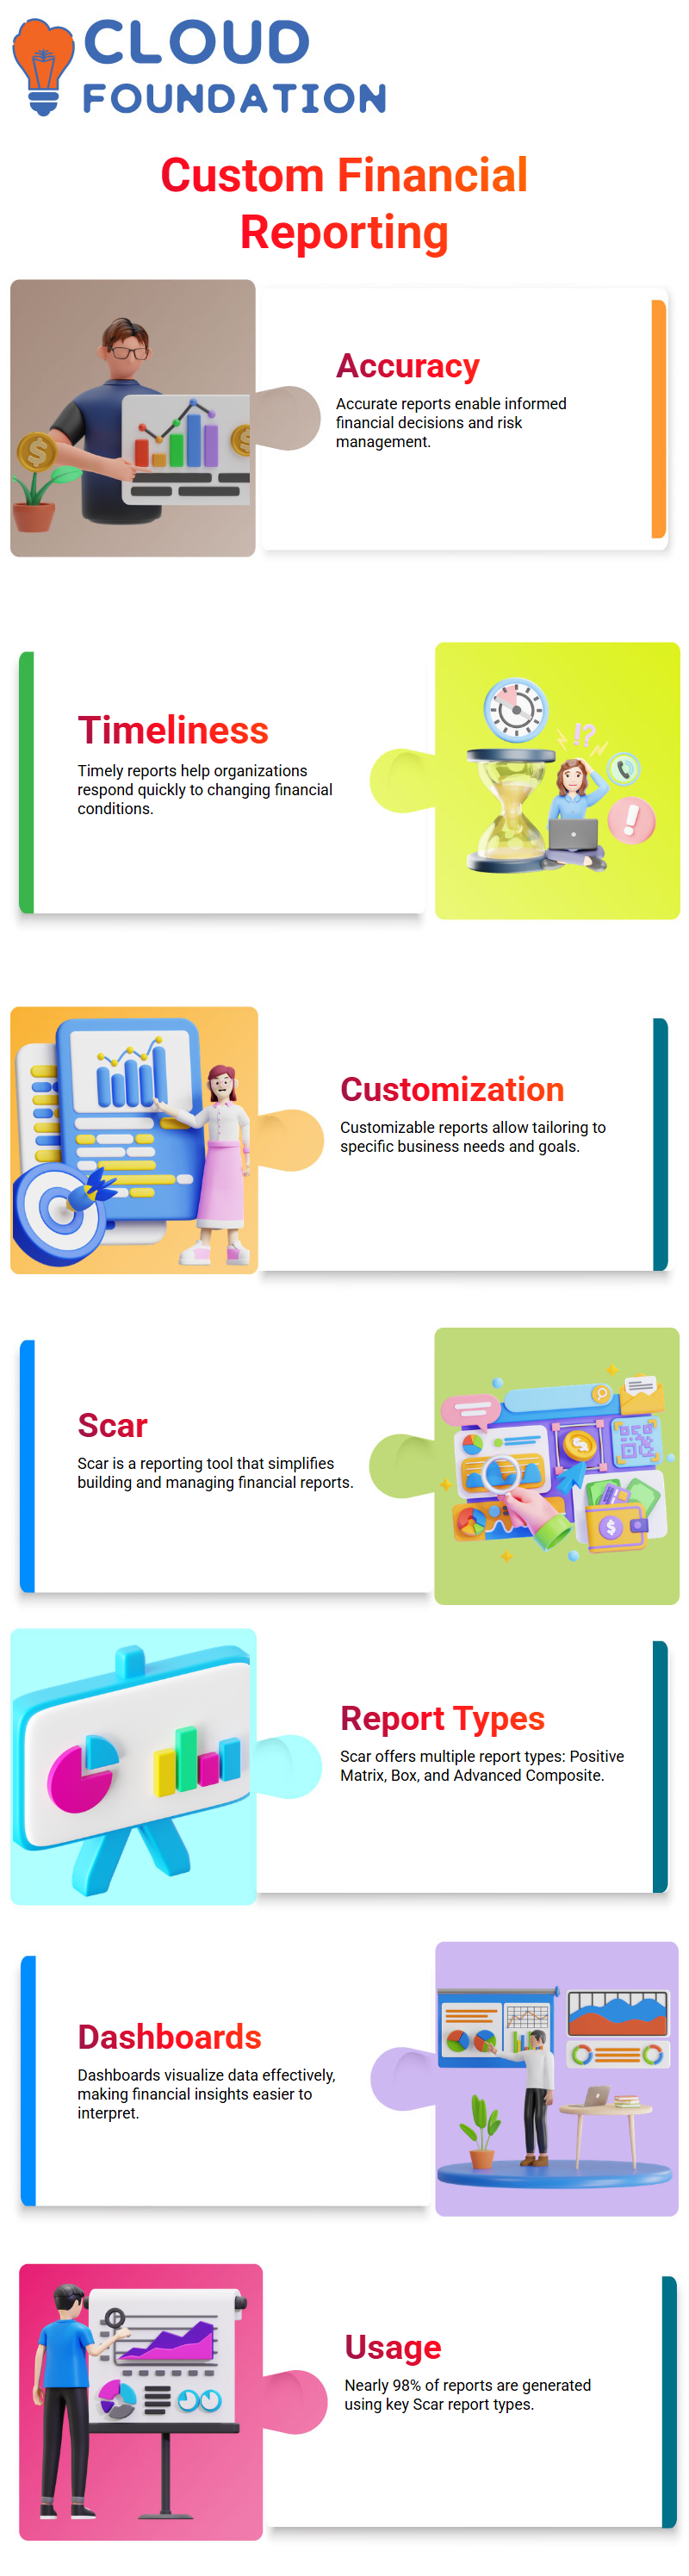
In the world of finance, reporting is everything. Accurate, timely, and customizable reports enable organisations to make informed decisions, manage risks effectively, and plan for the future.
One powerful way to achieve this is by using Scar, a reporting tool that enables users to create custom reports tailored to their specific business needs.
This blog post guides you through the process of creating reports in Scar, from selecting the appropriate report type to building dashboards that bring data to life.
Understanding Workday Report Types in Scar
Scar supports a variety of report types, each serving different purposes:
Positive Matrix Reports – Ideal for financial performance analysis with structured data layouts.
Box Reports – Designed for focused insights into key data points.
Advanced Composite and Matrix Reports – Provide a holistic view by combining multiple data sources and applying advanced filters.
Interestingly, Scar usage data shows that nearly 98% of reports are generated from these types, making them the backbone of most financial analysis.
Creating an Advanced Report in Workday
The process typically begins with reusing or “scraping” a previous report as a foundation. From there, users refine the fields, filters, parameters, and prompts to align with the specific performance needs of a particular workday.
A few highlights:
Optimised Data Sources – Only relevant, optimised sources are shown by default. To see all available sources, the “Scar” option must be unchecked.
Field Variety – Reports can include Boolean fields, date fields, multi-instance fields, and currency fields, each serving a unique purpose.
Business Objects – Scar organises data around objects such as Supply and Investment. These can be linked to other related objects, such as Payment, creating a network of interconnected insights.
For example, the Supply and Voice Document alone may include over 700 fields, showcasing the depth and complexity Scar can handle.
Exploring Business Objects in Workday
Scar’s business objects form the foundation of reporting. By typing queries like “business. Object” or “supply and payment”, users can view how objects interconnect across the system.
This allows teams to:
Map financial workflows, such as linking Supply with Payment.
Drill into detailed relationships for more precise reporting.
Avoid data silos by leveraging cross-object insights.

Workday Training
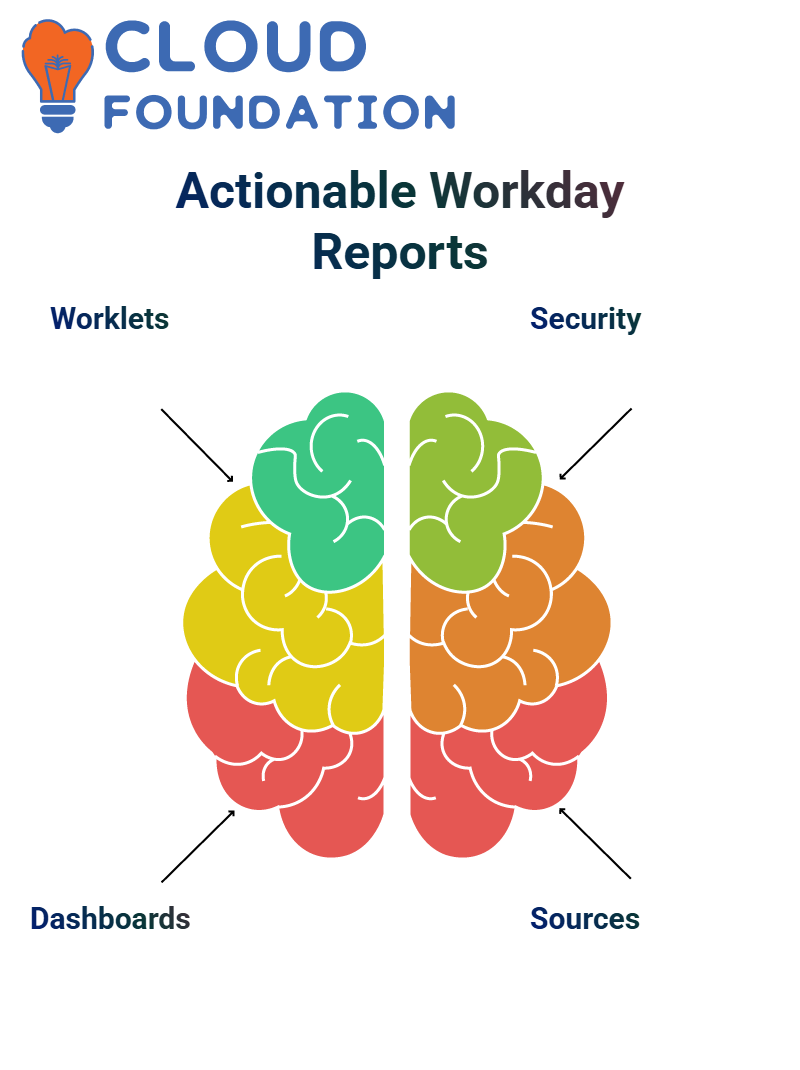
Worklets and Dashboards in Workday
Reports are most useful when embedded into workflows. Scar integrates them into worklets—mini applications inside dashboards.
Worklets can include business processes, reports, or links, making them accessible to employees and managers.
Dashboards can be customised per user, such as creating a Home Dashboard for employees to track key financial metrics.
Security Groups can be renamed and configured to control who sees what, ensuring data integrity and privacy.
 A simple dashboard can be created by adding a menu item (e.g., “Government Decision Report”) with just a few clicks. This makes Scar not just a reporting tool, but a decision-support platform.
Building Reports from Scratch in Workday
Sometimes, reusing a previous report isn’t enough. In such cases, reports can be built from the ground up.
This process involves:
Identifying the Delivery Code – A unique identifier for the report.
Choosing the Right Approach – Either a compositor code or a matrix compositor.
Selecting Data Sources – Based on business needs and available objects.
Creating Fields – Including special requests like Calvrid fields, which may require additional setup.
Testing & Migration – Reports are tested, refined, and either migrated to production or rebuilt in a new tenant.
Though time-consuming, this method ensures reports are perfectly aligned with client requirements.
Advanced Financial Reporting in Workday
One of Scar’s strengths is in financial reporting. For example, a matrix report can be built around key fields such as:
Invoice numbers
Supplier details
Currency values
Accounting posting rules
By limiting the number of columns and fields, Scar ensures performance while maintaining accuracy—sometimes reaching 98.99% accuracy with a single data source.
Reports can also be enhanced with:
Composite Reports – Combining multiple perspectives for holistic analysis.
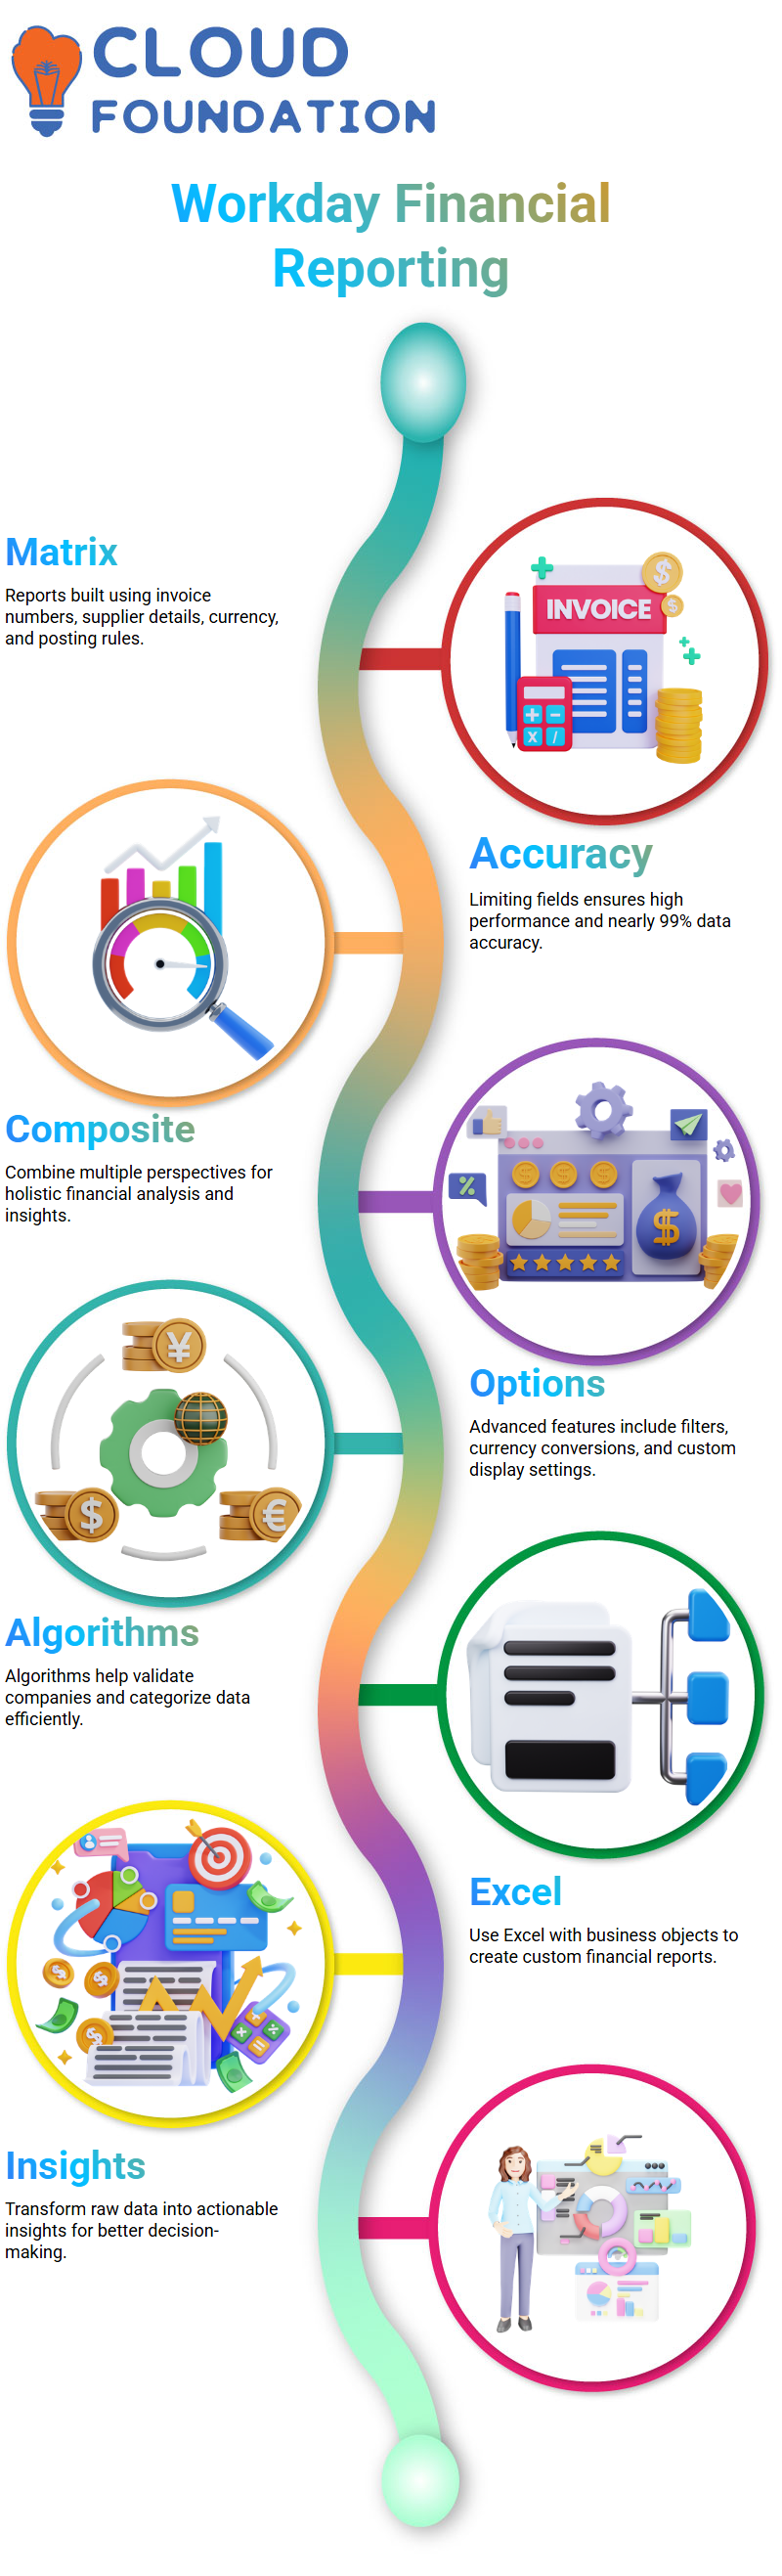
Advanced Options – Such as currency conversions, filters, and “show courage” (custom display) features.
Algorithms – For validating companies or categorising data efficiently.
Building Custom Composite Reports with Business Objects and Excel in Workday
In today’s data-driven business environment, reporting is more than just gathering numbers—it’s about transforming raw data into actionable insights.
A recent discussion shed light on how organisations can leverage composite reports using business objects and Excel to build custom financial and operational reports. Let’s break down the process, challenges, and opportunities uncovered in this discussion.
Why Composite Reports in Workday?
Composite reports combine data from multiple sources and structures, offering flexibility and more profound insights compared to standard reports. Instead of pulling data from one metric port or predefined structure, users can:
Include common fields like company, cost centre, and counts.
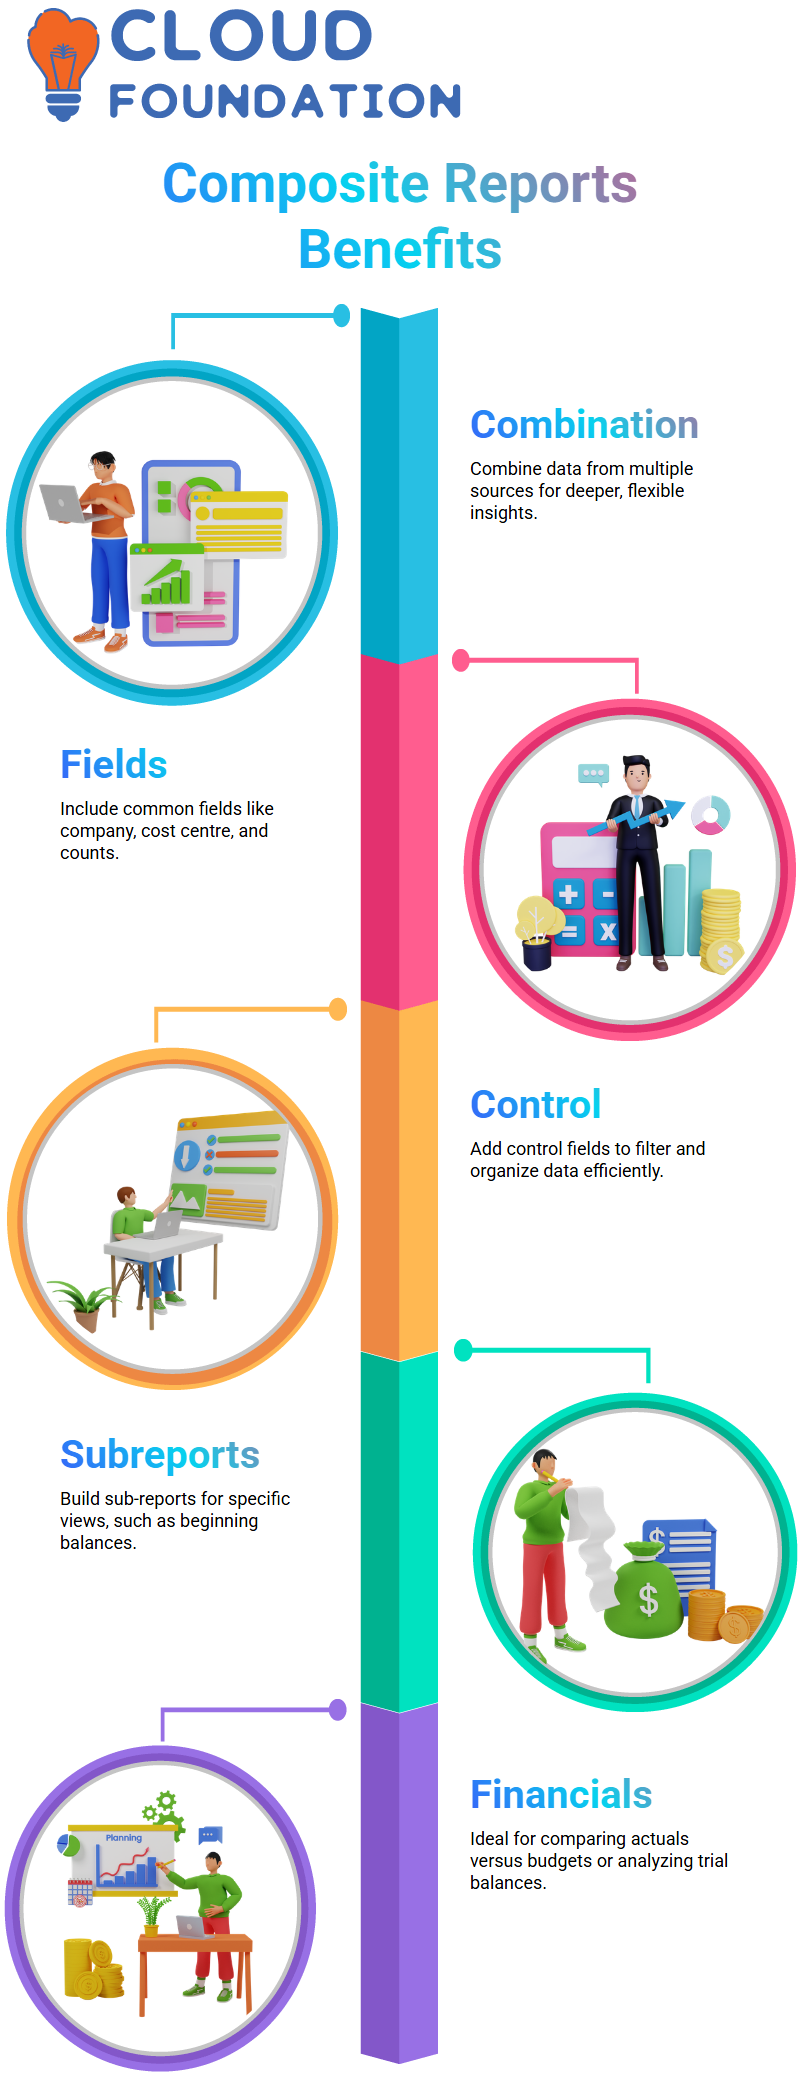
Add control fields to filter and organise data.
Build sub-reports for specific views, such as beginning balances.
This makes them particularly powerful for financial reporting, including scenarios like actuals versus budgets or trial balances.
Key Steps in Creating a Composite Report in Workday
Choosing the Right Data Source
Even when data sources remain available, choosing composite structures provides more control. Fields such as the company amount ledger and contact ledger can be mapped to ensure an accurate representation across tenants.

Workday Online Training
Adding Control Fields
Control fields act as levers for filtering and refining reports. For example:
Company usage
Cost allocations
Count columns
Up to 10 control fields can be added, helping shape the final output.
Defining Columns and Activities
Columns can represent beginning balances, ending balances, debit/credit activity, and adjustments.
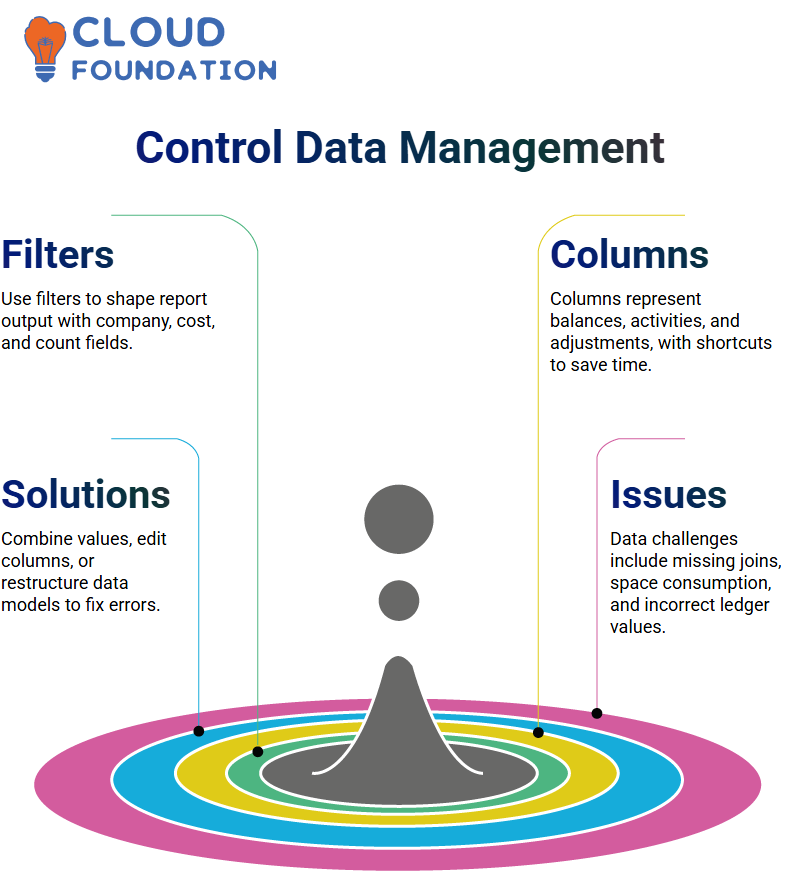
Shortcuts and column duplication can save a significant amount of time, especially when balancing repetitive financial data.
Handling Data Issues
Common challenges include:
Missing map fields for joins
Large space consumption by balance columns
Errors in ledger accounts not pulling the correct values
Solutions often involve combining values, editing column definitions, or restructuring the data model to achieve the desired outcome.
Using Excel as a Reporting Companion in Workday
Excel remains an indispensable tool for refining and presenting data. In the workflow discussed:
Columns were styled for readability (e.g., highlighting totals).
Custom calculations were defined (debit minus credit, relative activity, etc.).
Lookup functions were used to fetch company details like addresses.
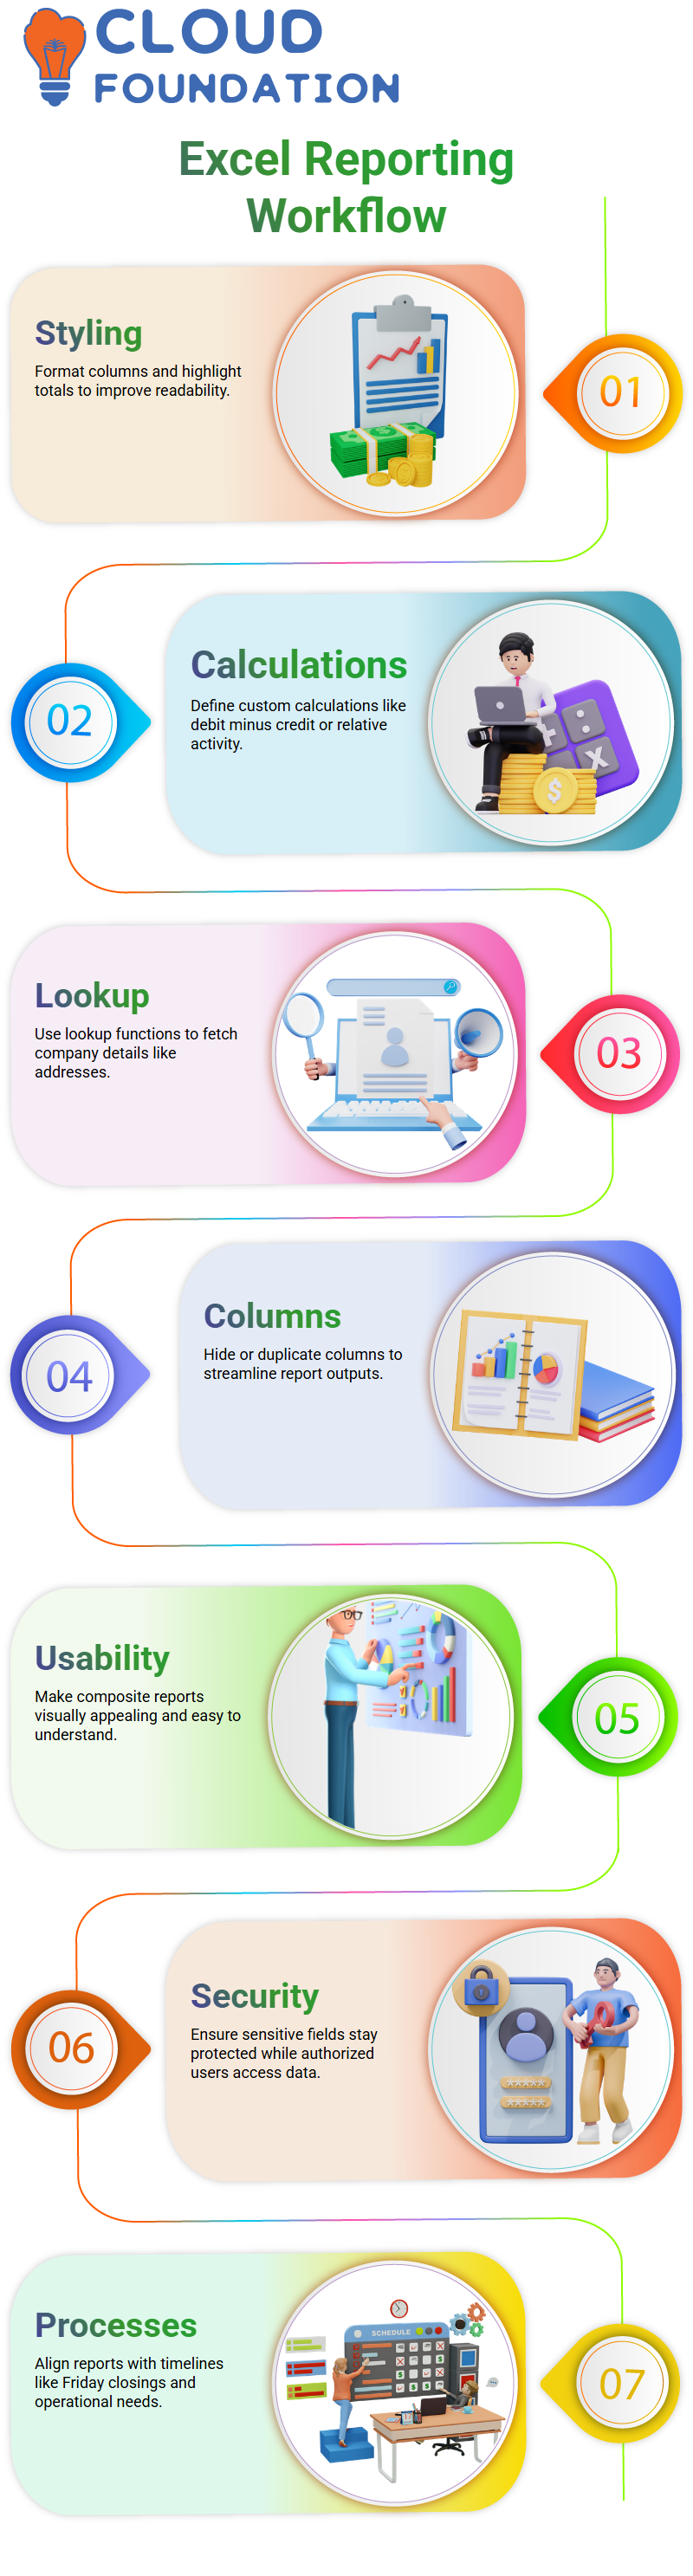
Hidden or duplicated columns were employed to streamline reporting.
These techniques make composite reports more user-friendly and visually appealing, ensuring stakeholders can quickly understand the insights.
Security and Business Process Considerations in Workday
Beyond the technical setup, the discussion touched on broader concerns:
Analytics and security: Ensuring data is accessible to the right people, while sensitive fields remain protected.
Business processes: Aligning reporting outputs with settlement timelines and operational needs, such as Friday closings.
These factors ensure that reports are not only accurate but also practical in day-to-day use.

Workday Course Price

Vinitha Indhukuri
Author