What is Amazon CloudWatch? AWS CloudWatch Tutorial for Beginners
By continuously monitoring and alerting users, organizations can improve their hardware and infrastructure utilization, reduce manual resource control, and prevent errors.
In this AWS CloudWatch Tutorial will look into the details of Amazon CloudWatch.
What is Amazon CloudWatch?
Amazon CloudWatch is a free tool managed by Amazon Web Services that provides data and insights to monitor applications, respond to system-wide performance changes, and gain a unified view of operational health.
It works by collecting data from a running server, monitoring applications in use, and pushing the data into CloudWatch for analysis.
It allows for continuous monitoring and alerting users when there is a spike in traffic or error. This prevents errors from occurring faster and ensures that issues are detected and resolved promptly.
AWS CloudWatch Features
Collecting logs and stores
Collecting built-in metrics
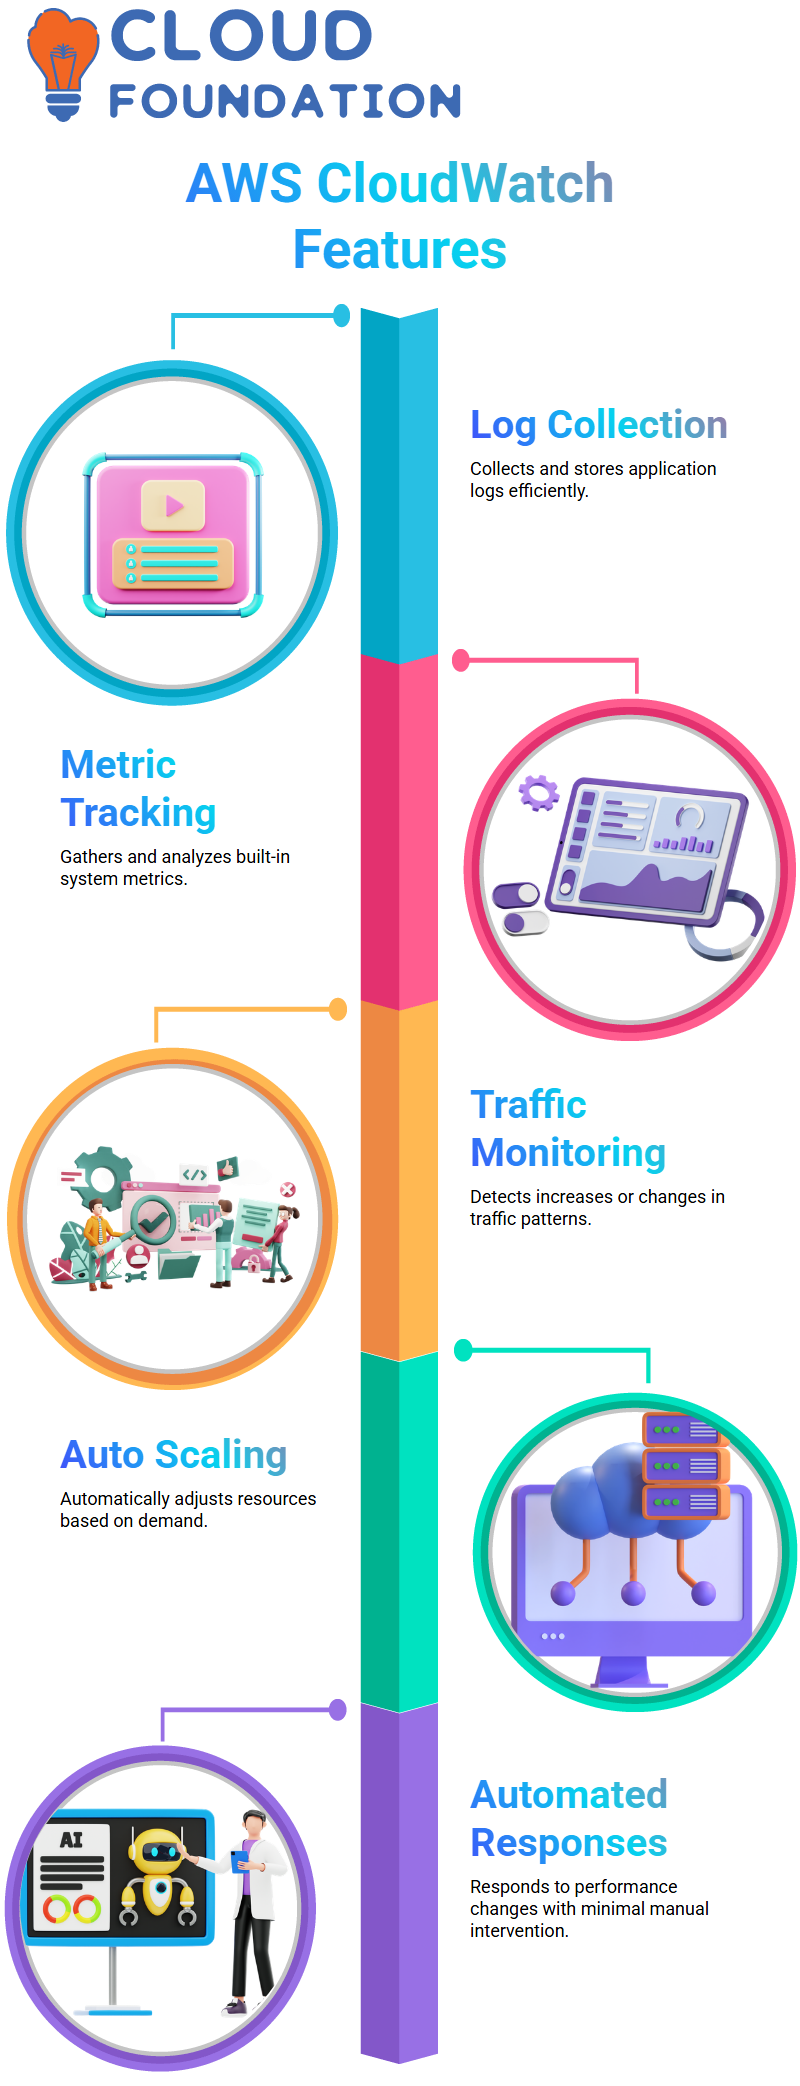
Monitoring for any increase or changes
Auto scaling and
Automated responses.
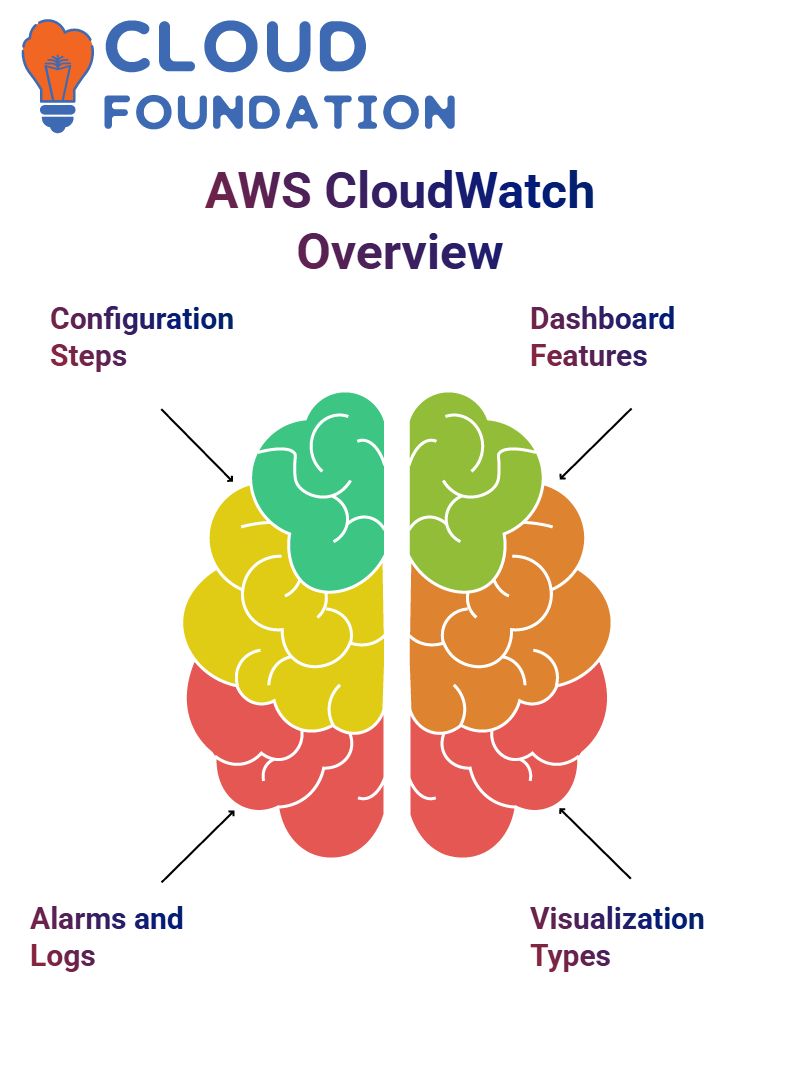
Configuring AWS CloudWatch
To configure the cloud watch, users can open a new tab, select the desired service, and then configure the matrix. This will allow users to configure alarms, logs, and metrics for their machine. By doing so, they can better manage their AWS resources and ensure optimal performance.

AWS CloudWatch Training
AWS CloudWatch Dashboard
A sample of a CloudWatch dashboard can be found on the top left, with multiple widget types available. The dashboard includes one hour, three hours, twelve hours, one day, three days, one week, and custom time periods. Custom time periods can be set to gather data from today to the past one month.
There are different widget types for dashboard visualization, including line, stacked area, number, text, and query results.
Line graphs show progression across time, stacked area graphs show the number at a specific time, and text shows what is happening.
The dashboard also provides free text with markdown formatting for easy access to data.
To use the CloudWatch dashboard, open a management console and navigate to the CloudWatch demo.
The dashboard displays alarms based on services, recent alarms, relative and absolute times, and custom and relative options.
The dashboard displays metrics such as CPU utilization, network packets, and discrete bytes.
Users can also choose from various time periods, such as one hour, 15 minutes, or 5 minutes. The dashboard also includes a stacked area for billing metrics.
Users can check the spending of their AWS account by linked account, service by service, total estimate charge, and USD.
AWS CloudWatch Namespaces
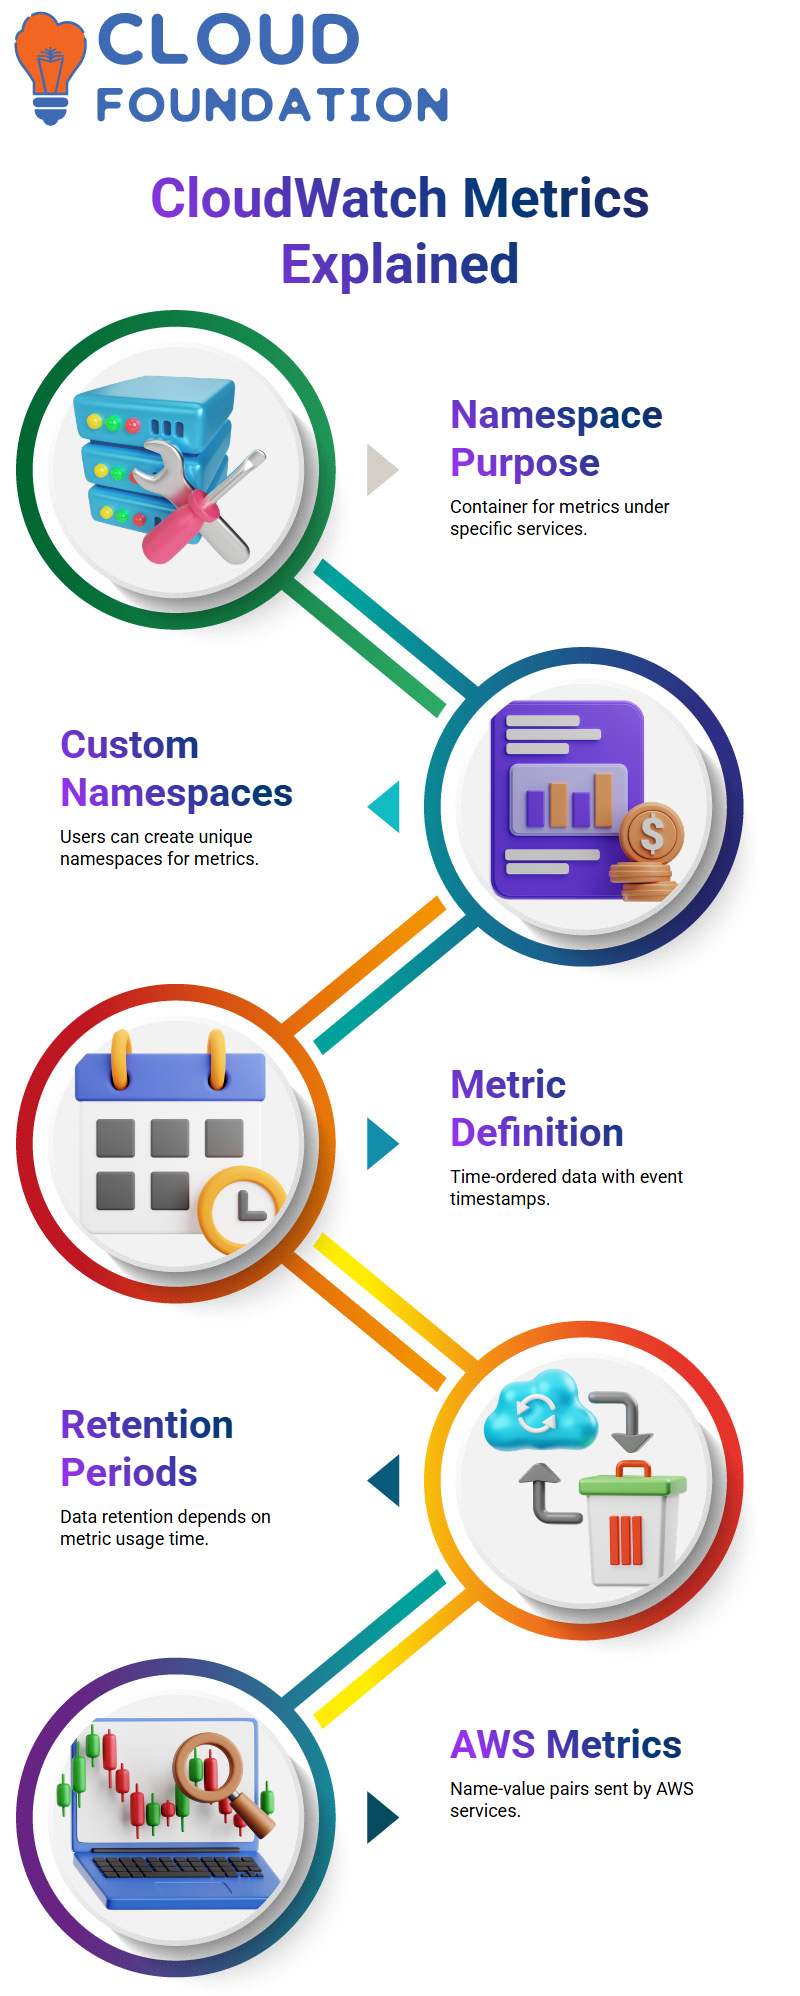
A namespace is a container for CloudWatch metrics, containing multiple metrics under a specific service. There is no default namespace, so users must specify a namespace for each data point they publish to CloudWatch.
Namespaces are in the format AWS/service name, like AWS/EC2. Users can also create their own namespaces for their own metrics.
AWS CloudWatch Metrices
Metrics are time-ordered sets of data points, with timestamps representing the date and time of an event. The widget displays data over time, showing the data of a service on the left and the time period on the right.
The timestamps are date-time objects, and the time period is determined by the user’s local time.
Metric retention is proportional to the retention period, with data retention being proportional to the time period. For example, if a metric is used for less than 60 seconds, it will be retained for three hours, deleted after three hours, and deleted after 15 days…
AWS metrics are a set of data name value pairs that are attached to every metric when an AWS service sends it to CloudWatch.
AWS CloudWatch Dimensions
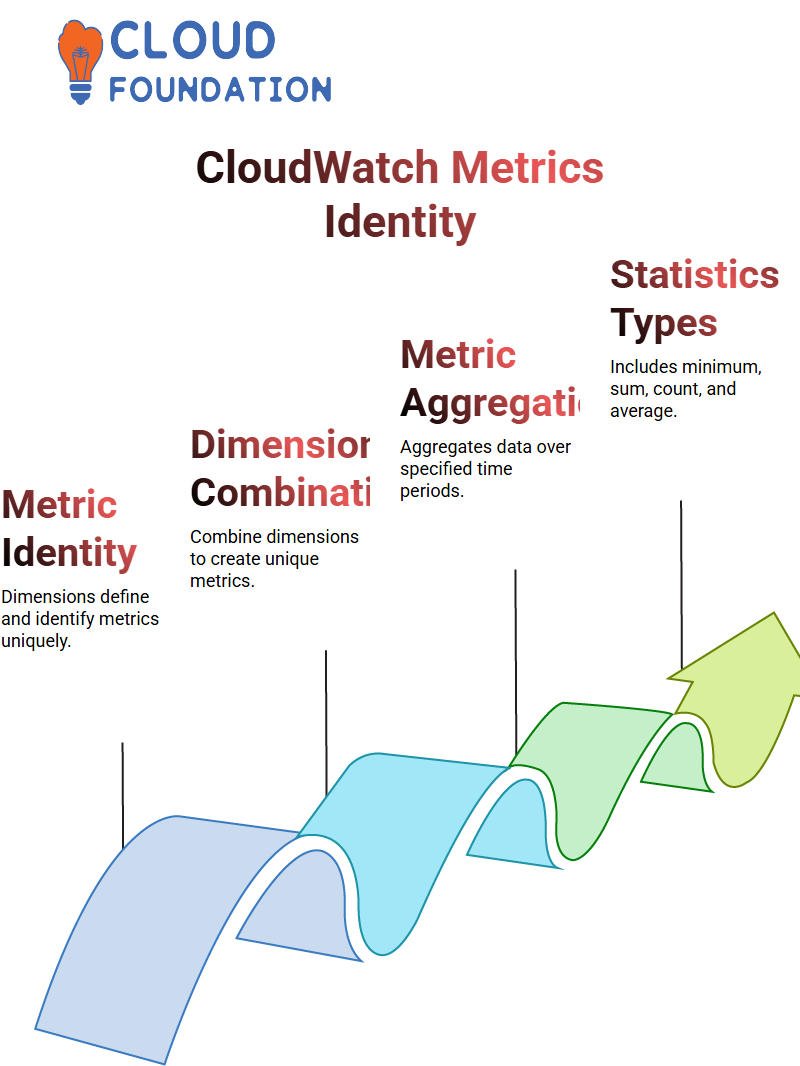
Dimensions are part of the identity of the metric, and when choosing a metric, one must choose a particular point.
Dimension combinations can be used to create separate metrics, such as 1, 2, 3, or all three dimensions. For instance, if you have three different dimensions named 1, 2, 3, or all three, you can combine them to create four different metrics.
AWS CloudWatch Statistics
Statistics are metric data aggregations over a specified period of time. They have various descriptions for certain names, such as minimum, sum, sample count, average.

AWS CloudWatch Online Training
AWS CloudWatch Percentile
Percentiles are used to indicate the relative standing of a value in a data set, which is useful for identifying anomalies.
For example, monitoring the 95th percentile of CPU utilization can help identify instances with unusually heavy load. However, percentile statistics are not available for metrics with negative numbers only for positive numbers.
AWS CloudWatch Timestamps
Timestamps are important aspects of CloudWatch, measuring up to two weeks in the past. They can be converted to your own format, but Amazon CloudWatch keeps data of the last two weeks only.
To capture data before two weeks, you must download and save the data. Units can include seconds, bytes, bits, percentage count, bytes per second, bits per seconds count, and more.
AWS CloudWatch Alarms
Alarms are used to trigger specific actions on behalf of CloudWatch. For instance, when CPU utilization goes above a certain point, an alarm will trigger an action or bytes downloaded whenever a certain number of bytes is increased or decreased according to the condition you provide. There are three different alarm states: okay, insufficient data, and okay.
Building alarms can be done using billing alarms. For example, if you want to monitor your estimated AWS charges for every month, you can create an alarm when spending goes above $800. This alarm will be triggered when a threshold is crossed, not using projections based on use but using the direct amount itself.
To create an alarm, select a metric, such as CPU utilization, and choose the value (average, sum, maximum, minimum, sample count).
The percentile can be set to the average. The instance, namespace, and metric name can be provided, and the period of time the alarm should be monitored.
When the CPU utilization is lesser than a certain point, the alarm will automatically go to alarm state without going to OK state.
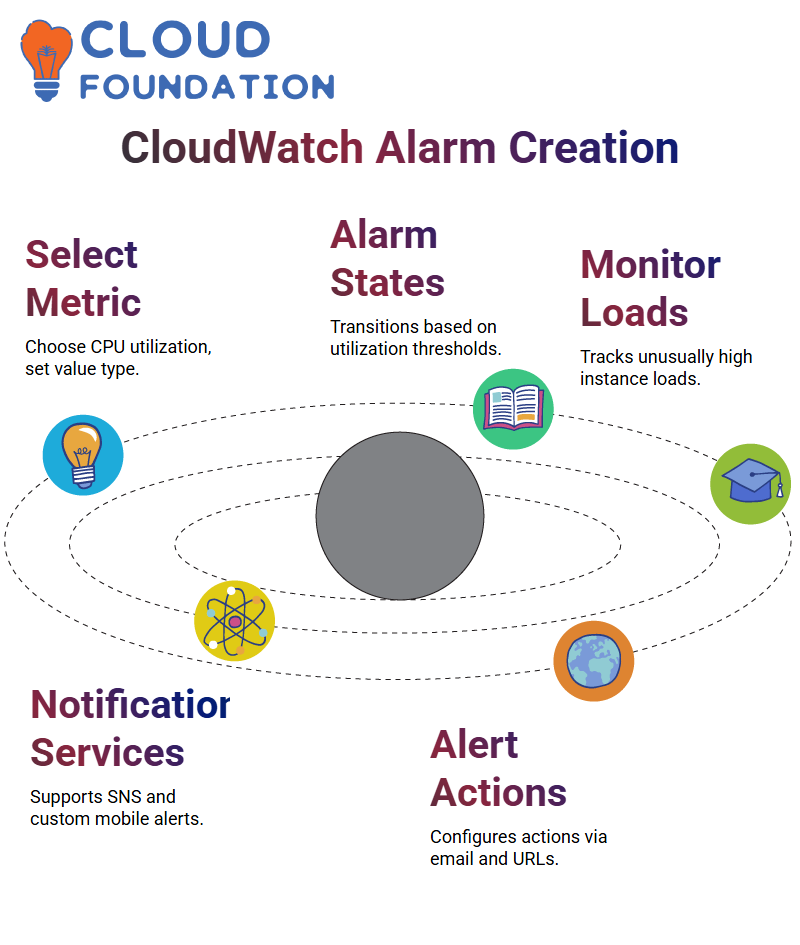
This helps you monitor instances with unusually high load and ensures that you have the necessary data to make informed decisions.
AWS CloudWatch Notification Services
CloudWatch also allows for three types of actions:
Amazon Simple Notification Service, which sends notifications over four channels, and Mobile Notification Service, which sends notifications to custom mobile notifications.
CloudWatch alerts SNS about an increase in CPU utilization, and SNS can configure actions to send an email to Entirely Path or notify over http/URL.

AWS CloudWatch Course Price

Vanitha
Author