SAP BOBJ Certification Training
Empathy Charts in SAP BOBJ
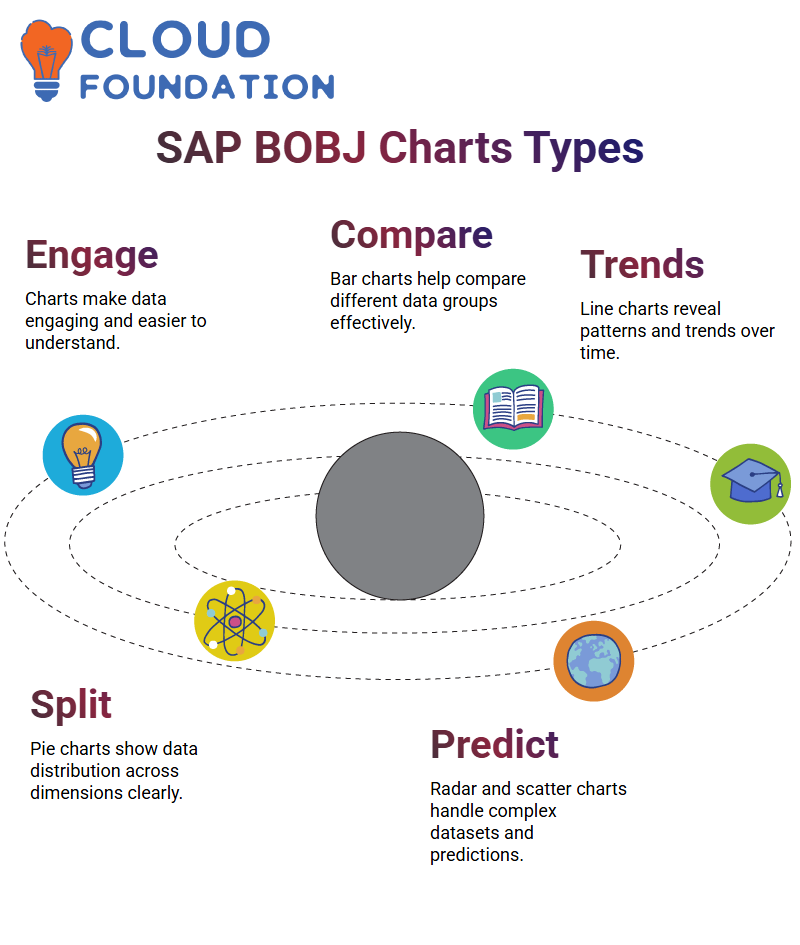
Visual representation of data using charts is one of the powerful features in SAP BOBJ.
Not only does it make data discernible, but it also makes it more engaging with the help of charts, rather than just employing tables.
 This module will examine the various types of charts in SAP BOBJ and how these charts facilitate data visualisation.
Types of Charts in SAP BOBJ
There are various chart types in SAP BOBJ, including bar, line, pie, radar, and scatter charts. Bar charts are suitable for comparing different groups of data, while line charts can reveal trends in data over time.
Pie charts are excellent because they make it easy to see how a single measure is apportioned across a dimension.
But in case we need forecasting or dealing with multifaceted datasets, radar and scatter charts in SAP BOBJ meet individual needs
Making use of Bar and Column Charts in SAP BOBJ
Bar and column charts are the primary tools in SAP BOBJ, transmitting data through horizontal or vertical bars.
They help to contrast sales figures over different periods or regions.
Still, there isn’t a guarantee that a bar chart will bring differences in sales revenue to our attention, as bar charts are still the first step in the process of grouping data before we dive into exact numbers.
Delving into high-level Charts in SAP BOBJ
SAP BOBJ goes beyond the basics of pie, bar, and column charts, by giving the users the possibility to construct more forward-thinking charts, as surface charts, radar charts, and scatter charts
Surface charts cover the area under the trend line, which emphasises the data size in totality. Radar charts link data points from different dimensions, thus making them an exact fit.
Creating Charts in SAP BOBJ
Creating charts in SAP BOBJI is a straightforward task.
First, you need to decide on the type of chart that best suits your conditions, such as a bar, column, line, or pie chart. Then, specify the dimensions and quantifiers, and collect the X and Y axes values. After that, you can view the kinetic results visually.
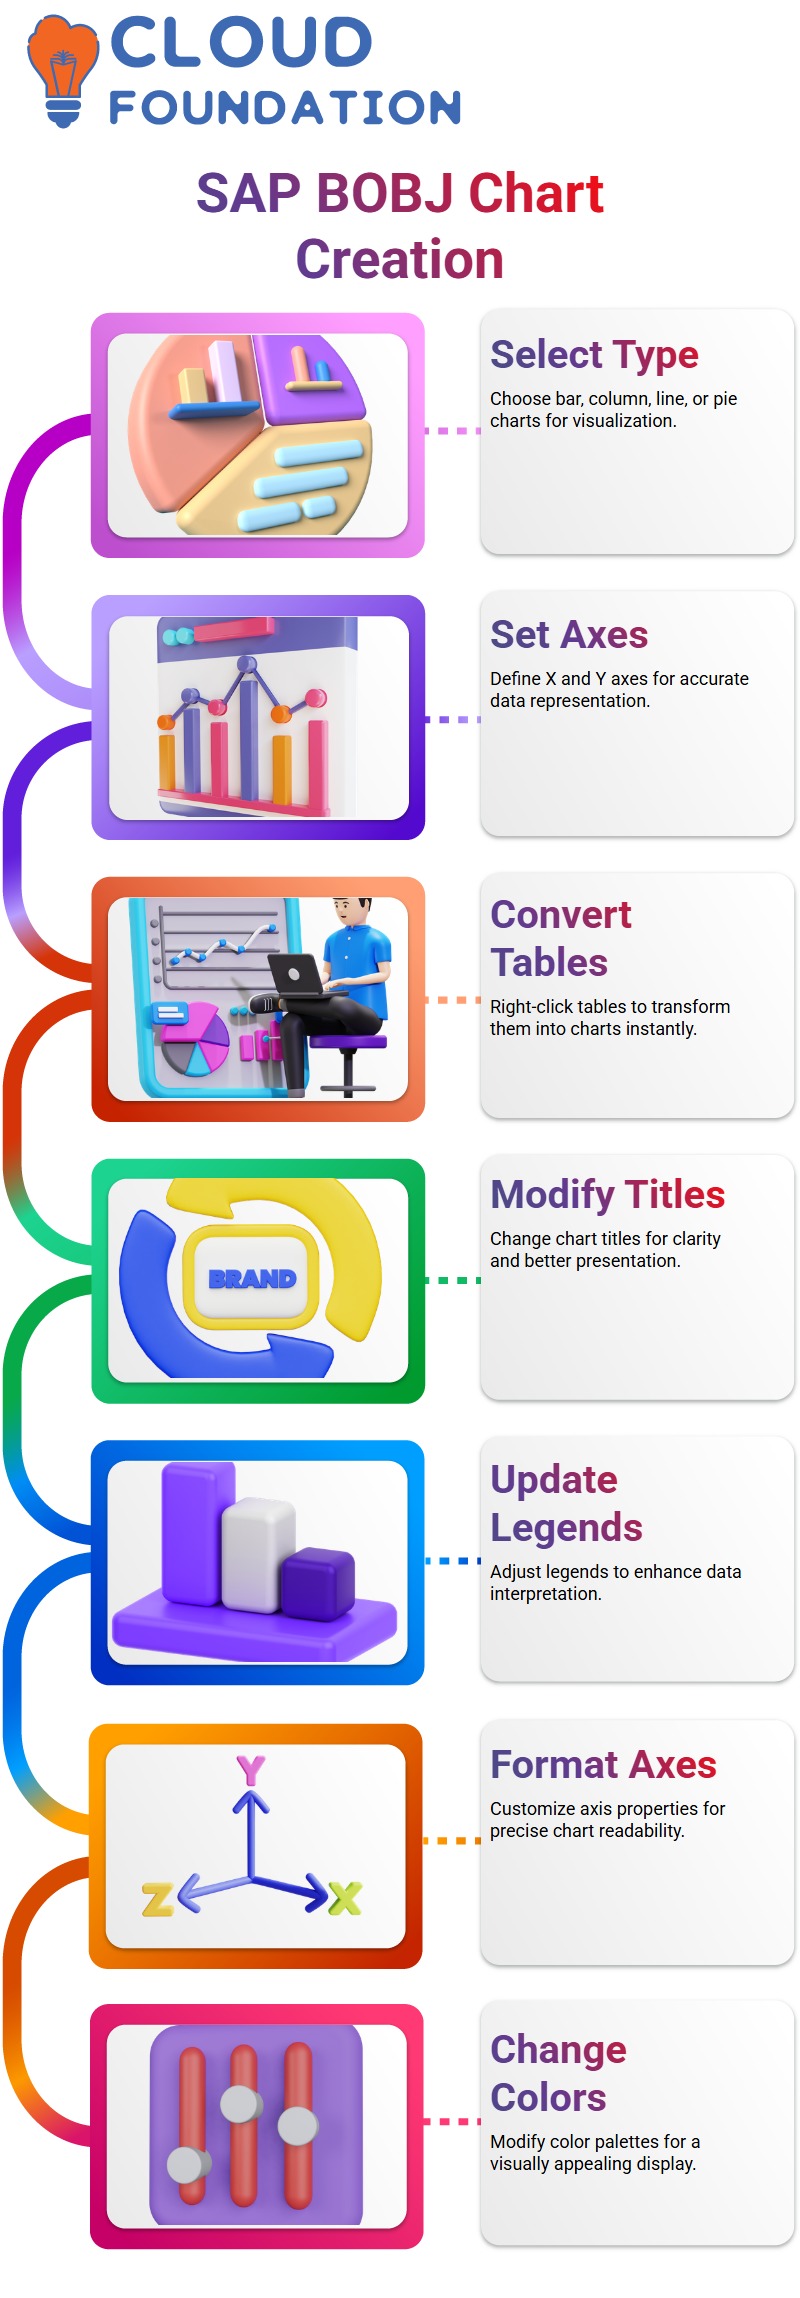
We can also easily change tables into charts by simply right-clicking them. After that, we can further change titles, legends, axes, and colours according to our preferences.
Formatting Charts in SAP BOBJ
As for the formatting of charts, SAP BOBJ is an excellent provider of a wide variety of tools, allowing you to modify the outline of your charts easily.
Users can modify titles, update legends, adjust axis properties, and change the colour palette for a more comprehensive representation.
We therefore confirm that the graphs meet the requirements of the reports through these minor adjustments.

SAP BOBJ Training
Prowess SAP BOBJ for Useful Data Portrayal
The SAP BOBJ tool is ubiquitous, no wonder it is your first choice, and if financed to the maximum, it can make data representation a breeze Also, if you are someone who is currently comparing values, filtering data, or customising charts, SAP BOBJ supplies you the flexibility to recast your visuals as it pleases you that are your exact needs.
For illustration, when representing quarterly data, it is worth noting that a category axis may not be required in SAP BOBJ.
One of the main advantages of SAP BOBJ is that we can, with the push of a button, only display the years we want to.
These modifications in the graph sketch, therefore, preserve the data integrity and prevent the graphic from being overloaded with unnecessary data.
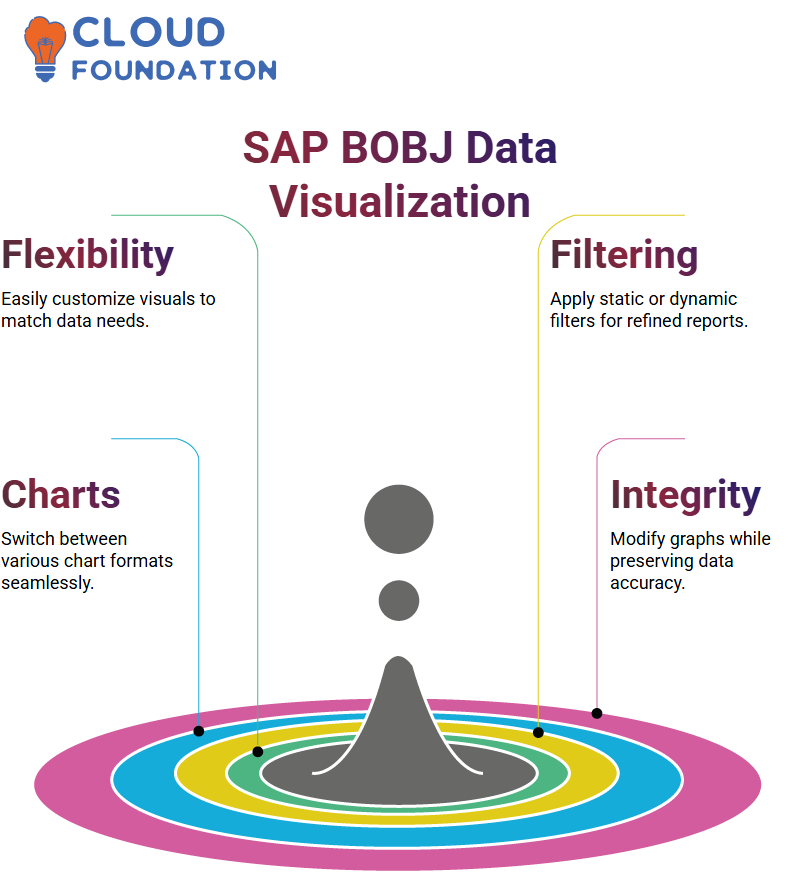
If you are not satisfied with the existing chart types, SAP BOBJ provides a quick way to turn charts into different formats. In case you need a bar chart, a pie chart or a line graph, SAP BOBJ guarantees you the correct display of your data.
With SAP BOBJ, formatting, filtering, and restructuring of graphs can be easily accomplished, thanks to the available tools that prepare clean and visually elegant reports.
Perception SAP BOBJ Filters
SAP BOBJ presents predefined filters. The filters that can be predefined in the SAP BOBJ can also be reused in numerous reports, owing to the nature of the E-fashion universe.
However, when it comes to convention filters, the potential is limited to the reports only, meaning they cannot be reused elsewhere.
The filters in SAP BOBJ that are static activate the setting of fixed values.
To clarify the explanation, if the state is defined as California, the report will always display only news from California without prompting for other values. Meanwhile, spirited filters accommodate variations in user input during report execution.
When we use a prompt instead of a constant value, SAP BOBJ requires us to specify the state or the country before running the report; as a result, it becomes very flexible.
How to Generate Prompts in SAP BOBJ
A thought-provoking attribute presented in SAP BOBJ is the ability to create prompts.
Whenever a report is being prepared, we specify an object to be the filter, select an operator such as ‘equal to’ or ‘matches’, and describe a prompt. This grants end-users not only the ability to spend their time more productively, answering the questions, but also to be free from static answers.
Upon selecting a prompt, the data refresh is executed for the given input.
The report is triggered to display the refreshed data. The preview mode is a tactic to secure access to dummy data without affecting the underlying data.
This trick is used in the report substantiation before the final run of the report.
Working with Report and Document Filters in SAP BOBJ
It is through filters that we can limit the results displayed in a report in SAP BOBJ.
Challenge filters are filters that affect the document as a whole, whereas report filters are applied only to specific tabs.
The introduction of the possibility to govern report filters that do not alter the definition of the problem has several benefits, including reducing the system’s load and increasing flexibility, particularly when an analyst wants to compare specific periods without modifying the primary dataset.
Dwelling Reports in SAP BOBJ
To construct Reports in SAP BOBJ, the first step is to select the universe, for example, E-fashion UNIX.
To receive a report explaining sales revenue by state and store name, we select the items listed in the drop-down menu, i.e. ‘State’, ‘Store Name’, and ‘Sales Revenue’
As soon as the challenge is run, the output is displayed in an organised manner.
If the transitions are required, we could replace ‘Sales Revenue’ with ‘Quantity Sold’ in the inquiry panel.
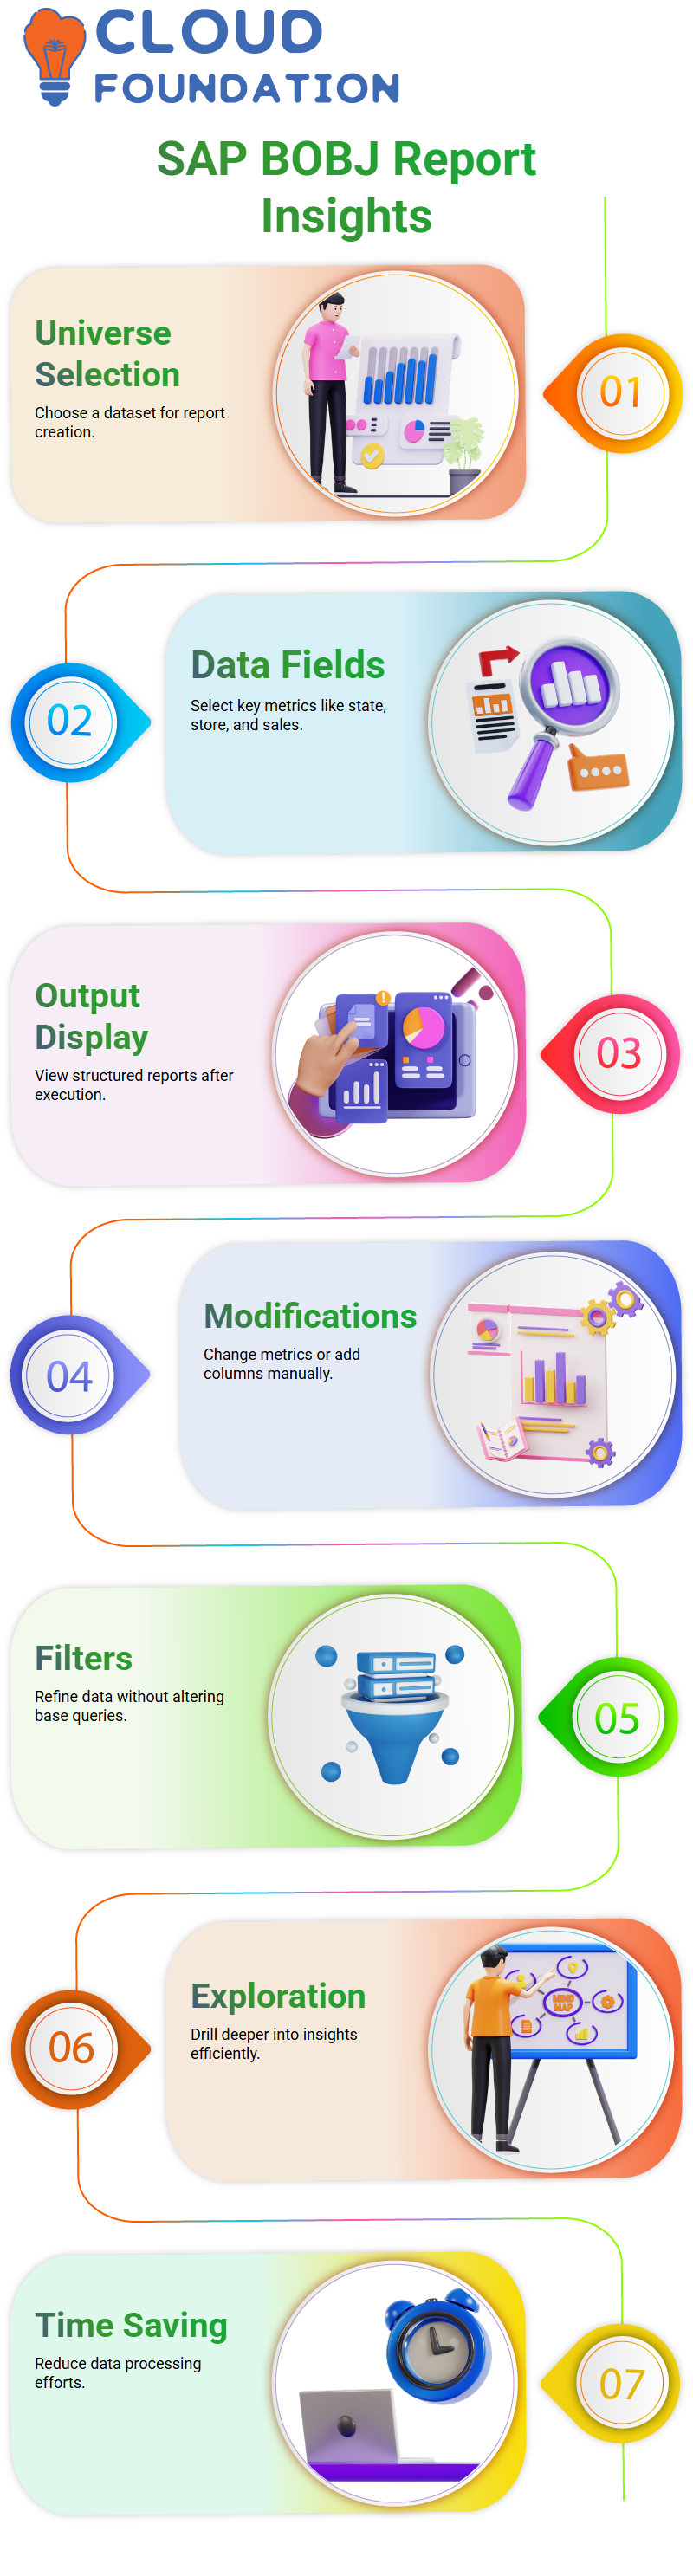
Changing still required the manual insertion of new columns into the report layout, ensuring the data remained structured for analysis.
Advantages of Inserting Filters in SAPBOBI
Applications of SAP BOBJ are such that it grants the ability to avail oneself of (report) filters which entail the process of drilling down data for more concrete or thoughtful data that can be visualised without changing the initial inquiries.
By this characteristic, no modifications can be made to the original issue but the users can through the data, make more exploratory steps while also reducing the time spent in the process of data picture.
Cognisance SAP BOBJ Reports
SAP BOBJ is the way to make and filter reports more quickly. We have created a simple report that tracks the quantity sold by year and quarter. With SAP BOBJ, we have chosen to select the state, store names, sales revenue, and amount sold as our initial data.
One of the things to be praised about SAP BOBJ is that it automatically handles SQL in the background.
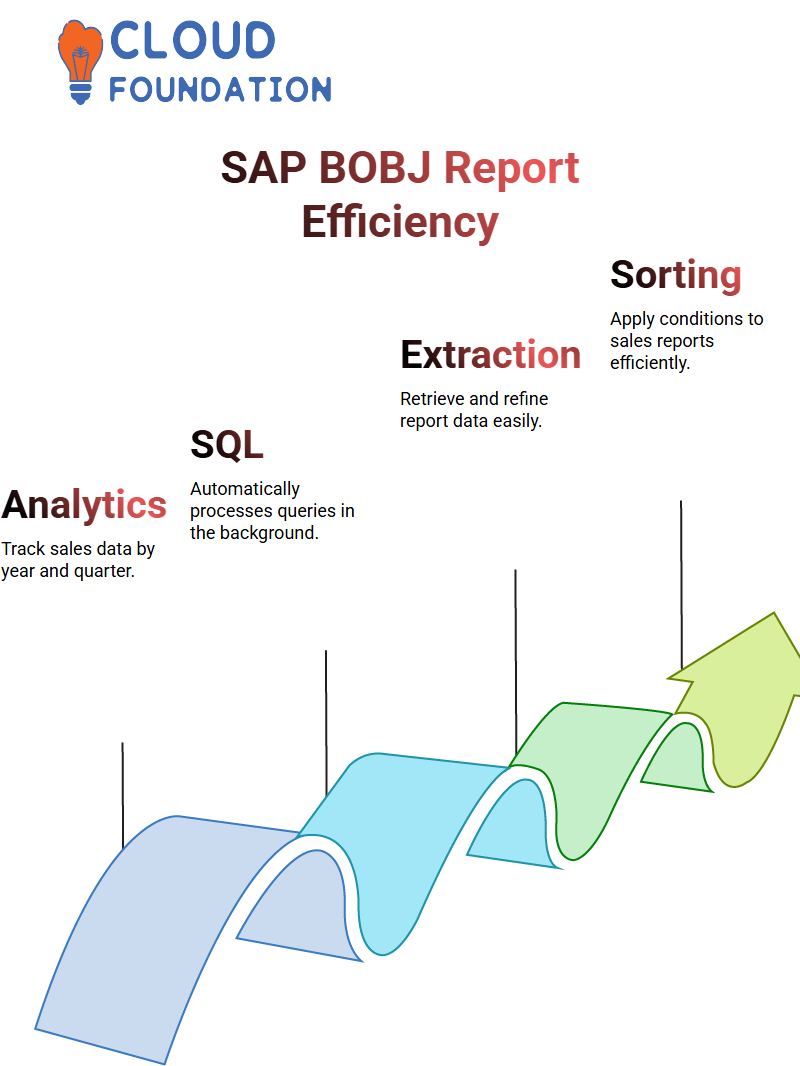
While manually writing concerns is one way, extracting data using SAP BOBJ makes reporting more expedient. Through the Investigation Panel, you can see the SQL of the report.
Capitalising on Filters in SAP BOBJ Reports
We can set filters in the report using the SAP BOBJ tool. By using sales revenue as an example, when working in SAP BOBJ, we can filter the sales revenue by state and store name exclusively.
The Problem Filter window provides an opportunity to filter results based on specific conditions.

SAP BOBJ Online Training
Saving and Organising Reports in SAP BOBJ
After generating the reports, they can be saved in SAP BOBJ. In case they are personal reports, we will save them under ‘My Documents’.
On the contrary, once they are intended for business use, we will move them to the public folders, thus ensuring that anyone in the company can access them.
Testing running reports in SAP BOBJ is a must before releasing them for general use. This is to certify the dependability and truthfulness of the reports.
Tests can be run, and after the tests, the reports can be put in the public folders for broader access.
Lively Filters and Prompts in SAP BOBJ
From time to time, people may want to have the option to select the data they want, as well as the flexibility to do so.
However, what if you do not have an exact set of filters that I can code for? This is where the vigorous prompts of SAP BOBJ come in.
A prompt verifies that while users are viewing or returning the inquiry, they can enter data that provides traditional filtering for the current situation or need to filter for.
SAP BOBJ will modify the results to match. Report generation with questions that are highly relevant to the business can be accomplished using this utility without requiring manual editing of doubts.
Amplifying SAP BOBJ Reports with Challenge Panel Features
In structuring a fine-tuning process in reports, the base gives alternative aspects to aid users in creating a functional report. Enhances SAP BOBJ report with the use of investigation panel features.
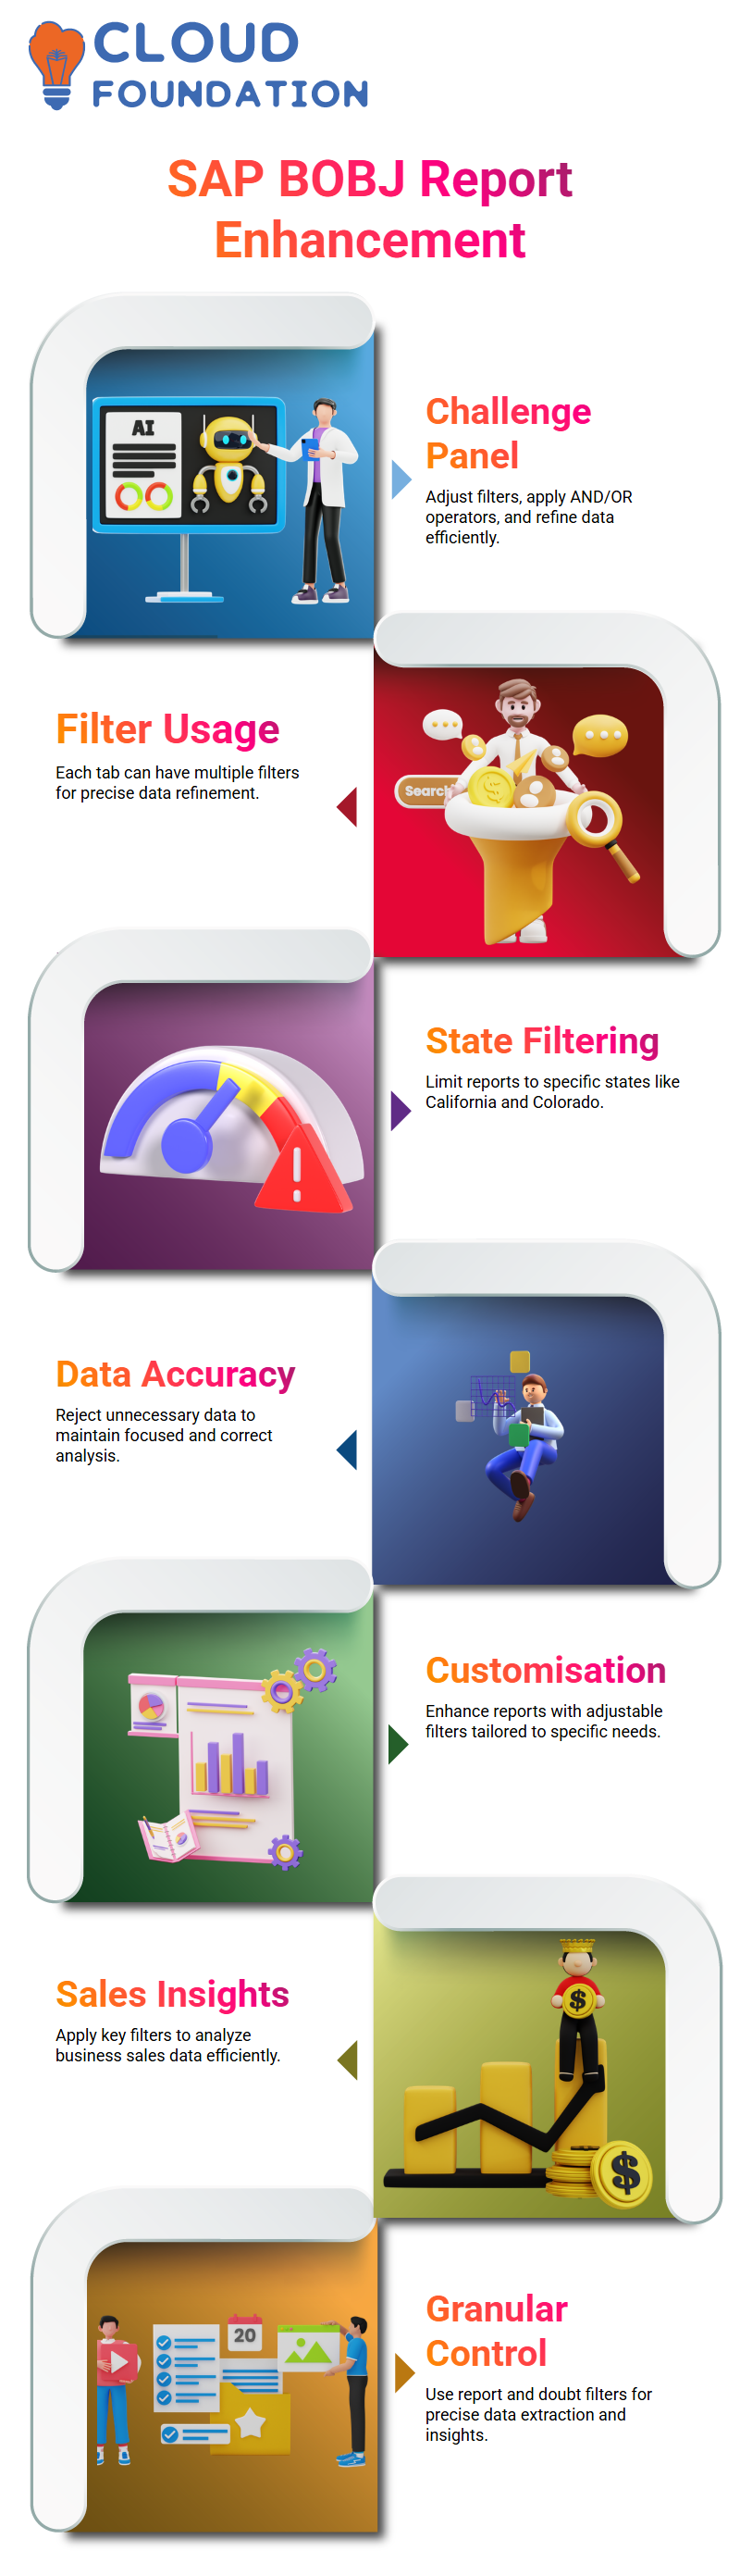
Employing the selections of the challenge panel, we can adjust filters, apply AND or OR operators, and restrict data based on specific demands.
 For illustration, by setting the indispensable filters for a report reflecting 2018 sales for California, the SAP BOBJ architectural software will carry out these operations swiftly, making data-driven verdicts the centre of business operations.
The Way Filters Work in SAP BOBJ Reports
In SAP BOBJ, each tab can have multiple filters, and the data filtering aligns accordingly with the mandates.
We should select the block where we want the report filter, press the ‘Add Filter’ button, and voilà. The state filter is being shown.
But what if we limit our choices to California and Colorado? To describe these values and click the ‘OK’ button, SAP BOBJ will verify data only for California and Colorado, which are within reach.
This implies that the recreation of the states should be rejected; thus, our analysis remains single-minded and correct.
That is the magic of report filters in SAP BOBJ. If you are organising sales data or reducing customer data to a single sector, these filters help you connect to the exact statistics you need.
Making use of both report and doubt filters is the way to go with SAP BOBJ for you to have not only the most granular control over data you fetch but also a possibility to be twice as customisable.
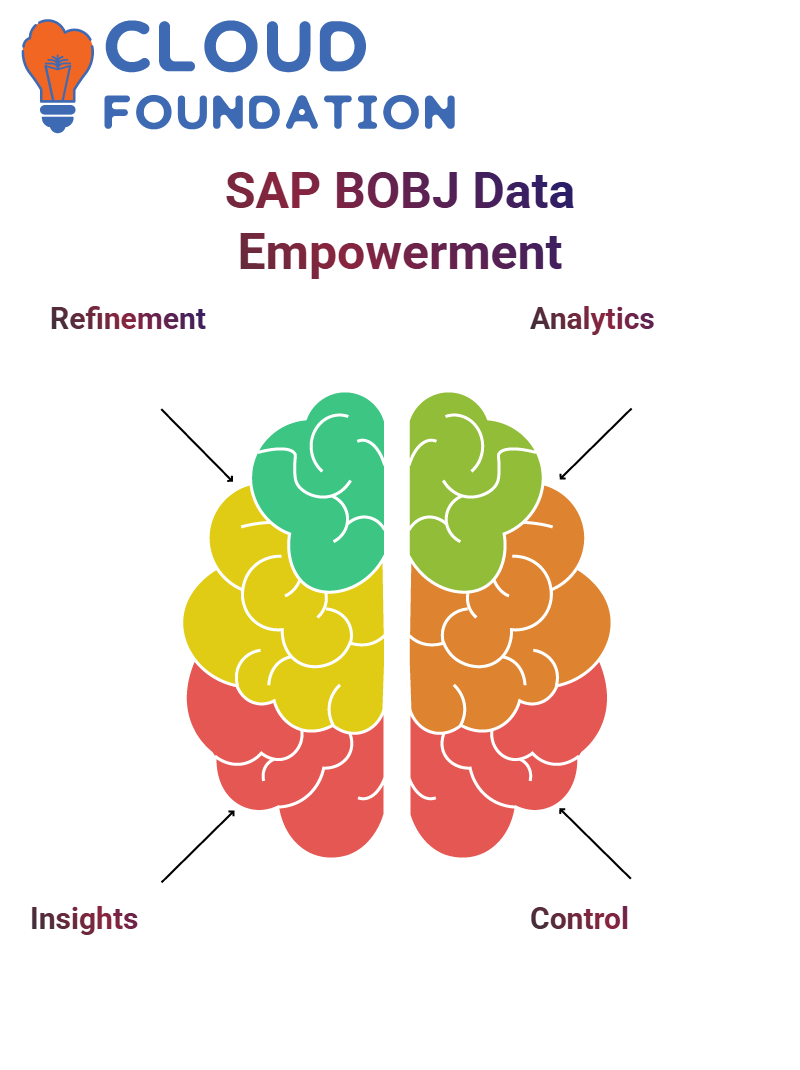
How SAP BOBJ Empowers Data Analysts
SAP BOBJ that empowers the operations of a data analyst. I mean it’s not just about the world of filters that make your small or large data or long reports so attractive. The point is that the flexible nature of SAP BOBJ solves countless problems and makes it a handy tool in the business.
BOBJ is the name of the game for those who want more interactive and user-friendly reports. Do you have a concrete exemplar? Of course, through the use of filters.
 Have you come across a list of inquiries? Then, with a smile, you can easily retrieve the answer that is on the surface.
SAP BOBJ is providing answers out of raw numbers, so the conclusions become intelligent and faster here, which can be executed with SAP BOBJ
When it comes to reports, try using the filtering alternatives in SAP BOBJ, and you will feel more confident in applying them, as the control over your data will be stronger.

SAP BOBJ Course Price

Vinitha Indhukuri
Author