How to Learn AEM Debugging
The concept of Debugging in AEM
Being able to debug might be one of the primary skills required for any work linked to AEM projects.
Whether you’re trying to solve a problem with the backend or dissecting logs, the skill of debugging can save your work.
For demonstration purposes, we will walk through the process of setting up AEM for debugging. First and foremost, we confirm that the server is in debug mode.
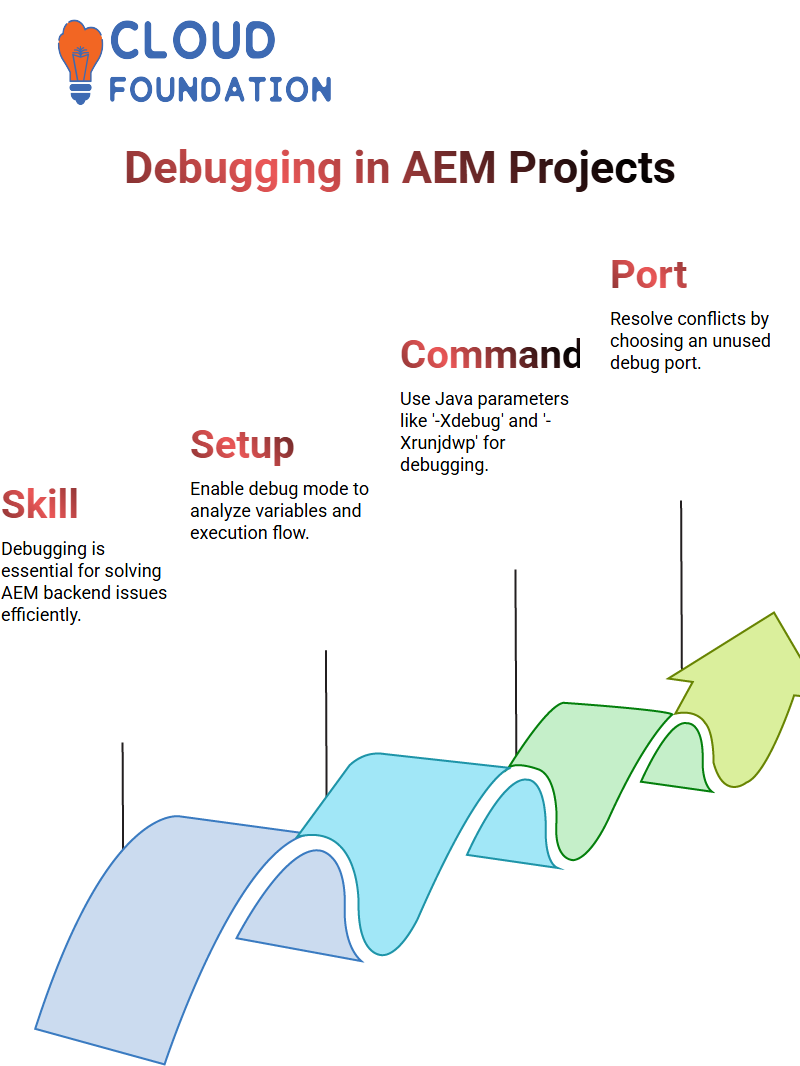
This action will enable us to view the value of variables, understand the flow of execution, and solve problems effectively.
Debugging in AEM
AEM debugging is an indispensable competency in AEM development, as it enables you to identify non-trivial issues and therefore be more productive.
In the case of AEM, it is necessary to check the values frequently, and having the correct setting for debugging will make troubleshooting much more straightforward.
AEM debugging is a crucial stage in enriching our application knowledge. It is obligatory to follow the process of setting the breakpoint at the key line that allows us to follow the control flow.
The first step in troubleshooting AEM-related issues is to configure your AEM case in debug mode, which is a required step. When AEM does not start due to port conflicts, we are usually in trouble, and the knowledge of port resolving is the main point.
To start with, we have to use a Java command that starts the AEM server with the debug parameters.
The structure usually involves alternatives like ‘-Xdebug’, ‘-Xrunjdwp’ and the specified port number for debug When performing the set up of AEM, we opt for a debug port that is not in use by any of the processes already running.
Integrating Debugging in IntelliJ
The following task, which is performed after AEM is running in debug mode, involves integrating AEM with IntelliJ for easy debugging. Thus, we can confirm the smooth and simple debugging process.
In the “Run” menu, we set up a debug configuration remotely and add the host as “localhost” and the debug port as “30303”.
This problem means that the debugging session of AEM coincides with the one IntelliJ is expecting.
To check our settings and confirm that the system console logs show that the server starts with the debug mode.
To this end, we have to change the following, check the logs in the system console to verify that the server has started with the debug model, and if it hangs due to the port already being in use, we continue by killing the process in ‘Activity Supervisor’.
Problem-solving AEM Debugging Issues
The debugging process for AEM requires close attention to detail. If AEM fails to start correctly due to an erroneous port being in use, investigating and closing unnecessary running Java processes is more than sufficient to resolve the issue.
Another essential thing to consider is using the ‘-XX: HeapDumpOnOutOfMemoryError’ option to prevent applications from crashing.
When troubleshooting, we also adjust the logging levels, which provides finer visibility. Employing options such as ‘-DlogLevel=INFO’ would provide a more transparent and understandable log, ultimately leading to quicker problem resolution. With the correct settings, the AEM can run in debug mode adequately.
Establishing Connection in AEM
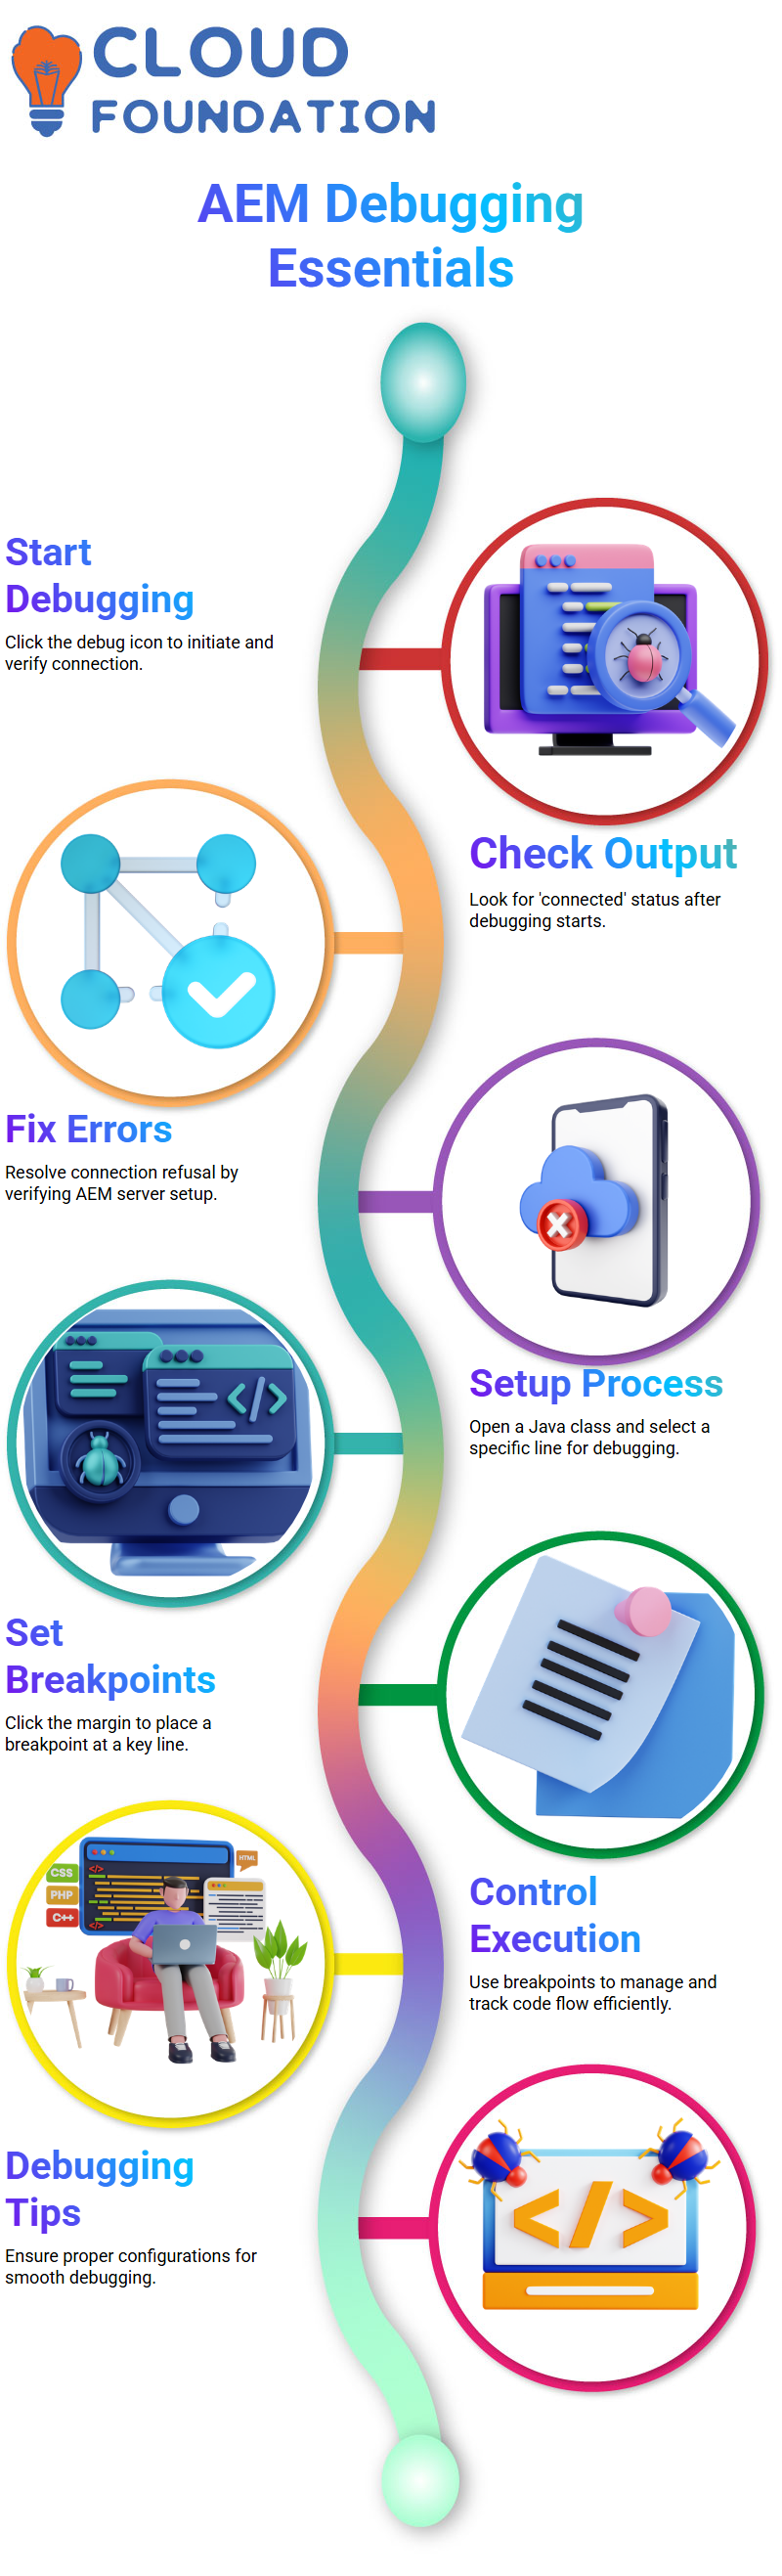
Clicking the debug icon initiates the connection. A new terminal output that reads ‘connected’ should be visible if everything is done correctly on the running AEM server.
If you haven’t, please ensure that you have started your AEM server properly.
For those of you who receive a connection refusal error, don’t be upset.
You’re not alone, Now, permit’s only work with those who are already connected and come back to any issues we will deal with later
Setting Up Debugging in AEM
The first step to debug the AEM project is to open a Java class and locate a specific line, such as line 40. Then you need to click in the margin next to the line number on the left.
By doing so, a red dot will appear, indicating that the breakpoint has already been set.
The execution of the code becomes easier and quicker if we use breakpoints in AEM debug, as they help us stop the code at any point. Etc.

AEM Training
Debugging Logs in AEM
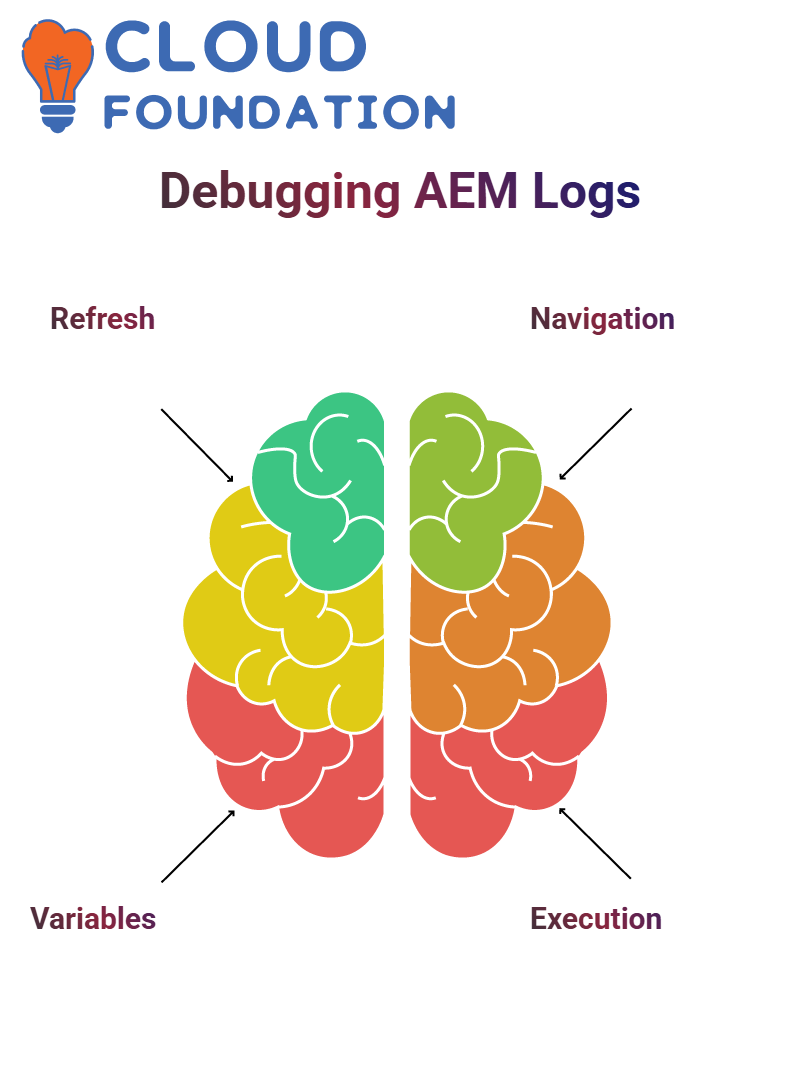
Once you press Ctrl+R for a page (browser refresh), you can then follow and inspect the debug data. While the Java class corresponding to the JSP is running, the line will be highlighted.
With AEM displaying each new variable, it provides a means to view data, follow the program’s flow, and verify the program’s logical correctness.
Debug Varieties in AEM
AEM provides numerous debugging opportunities. Release’s have a look at them. ‘Step over’ and ‘step into’ are used to sail through the functions, whereas ‘step out’ will help you leave the current function scope.
 If you press ‘Resume Program,’ execution will continue up to the next breakpoint, where you can stop the debugger at any time by unplugging it.
Debugging AEM Servlets
AEM also enables debugging of servlets. When you are not sure about the execution of servlets, you can always open the file, place a breakpoint in it, and use the servlet’s way to gain access to that servlet.
When you have entered the lane-based servlet through localhost, the execution stops at the set breakpoint, and the current state of local runtime variables can be checked for troubleshooting needs.
Remote Debugging in AEM
In remote debugging in AEM, developers can observe what is happening in the code as it runs on a physical device.
Many developers face difficulties in setting up remote debugging. Still, after understanding the core concepts, it will become an inevitable tool.
When your file is requested, the actual values being processed are displayed, and you can efficiently identify errors in AEM applications.
Please keep in mind that remote debugging should be practised on the local machine and should never be switched on at higher levels.
AEM development recommended practices advise against enabling debugging permanently, as it can consume excessive system resources and slow performance.
One of the key points that AEM debugging typically addresses is connection error issues. If your server is on one port while the debugger is connecting to a different port, you need to configure them both. When the server is rebooted with the correct settings, it ensures that the debugging process runs smoothly.
Sharing your screens and troubleshooting problems together is a practical way to learn AEM debugging processes.
AEM development is all about practical trial and error, as well as incessantly refining oneself. Parallel to that thought, if you engage in imaginative ideas one after another, you will become accustomed to them without noticing it.

AEM Online Training
AEM Server in Debug Mode
For AEM to be in debug mode, the server must be executed with the debug option as the first step, then you can continue by attaching your IDE to the server’s debug port.
AEM developers often opt for straightforward methods to keep debugging enabled in a startup script, although this can also lead to unnecessary performance issues. The right way is to use the one-time start-up debugging arrangement.
Often, developers encounter a significant problem with AEM when they inadvertently activate the server’s debug mode for various reasons.
Enabling debugging in the startup script may slow down the system and consume a significant amount of memory.
The most suitable solution is to shut down the AEM server, make the requisite developments, and only activate the debug mode when it is required again.
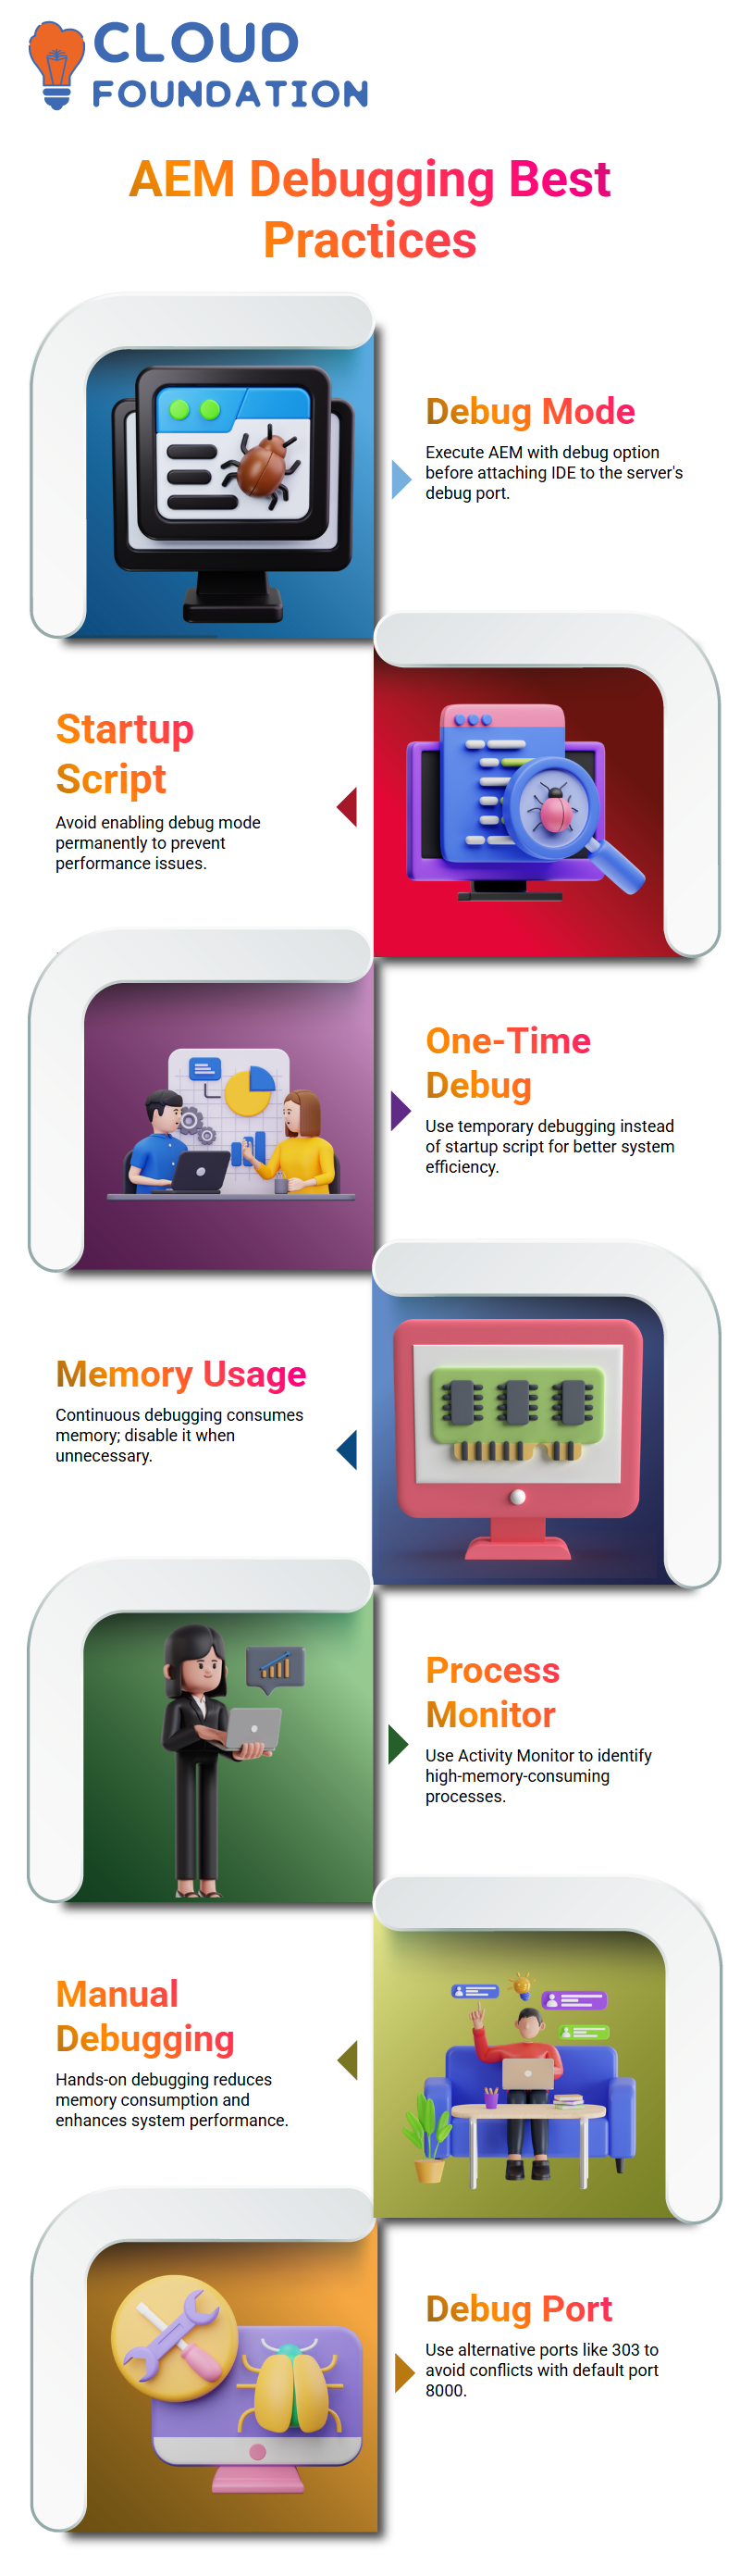
Alternatively, developers can use tools such as Activity Monitor on macOS to identify the processes consuming a significant amount of memory.
In AEM, Java processes frequently require a lot of system resources, but if they can be recognised early, performance can be optimised more effectively.
Productive Debugging Tactics in AEM
Developers must refer to the most suitable debugging methods when determining the right course of action in AEM.
Beginning the AEM server in debug mode can be done manually or by configuring the start script. Despite that, hands-on control guarantees lower memory consumption and improved performance.
During the configuration of the debugger, developers must pay attention to selecting the appropriate remote debug port to avoid any conflicting settings in the AEM system.
The debugging port 8000 in AEM is a default setting, not a requirement. Electing another one, such as 303, will enable debugging without disrupting other processes.
How to Make Debugging in AEM the Most Useful
When running a debugger in AEM, it incorporates the settings of Java courses that are relevant to the context. Developers must correctly set up debug mode, including memory parameters for execution, to prevent memory settings from causing unnecessary performance slowdowns.
The debugging commands must also be error-free, meaning they must be correct from the moment of setup to the actual absence of errors or their occurrence, and everything in between.
 Ensuring smooth debugging in AEM is possible by setting up and checking the syntax correctly.
IntelliJ AEM
As soon as we activate IntelliJ’s debug mode, we should proceed to connect IntelliJ. Click the green bug icon in the upper right-hand corner to establish the connection.
If everything works well, IntelliJ will connect to the AEM process with a click.
At this stage, it is essential to set breakpoints that allow you to stop the program at a specific location. This way, you can inspect the variable values and trace the program execution.
Observing the etiquette of AEM products is a highly effective way to gain a deep understanding of how they work.
Debugging as a Tool in AEM Projects
We can debug AEM projects competently if we learn to utilise debugging effectively.
Even if we do not have a firm grasp of Java programming, the ability to debug comes in handy for productive troubleshooting.
An AEM developer is generally occupied in debugging to find the causes of performance decreases and errors, and to ensure that habit components in the AEM ecosystem run correctly without any issues.
Summary of AEM Debugging
Once the debugging setup is made correctly, it is possible to solve any issue in AEM. The possibility of checking the course of an execution, changing some values, and thus solving problems makes easy development in the AEM environment.
Applying the tactics of debugging, we can not only invent time for more work but also increase the probability of working successfully with the AEM projects.

AEM Course Price

Vinitha Indhukuri
Author