Crystal Report tutorial
Crystal Reports is a business intelligence (BI) reporting solution that gives users the ability to create, publish, and distribute reports that are data-driven and display dynamic information.
Currently, SAP is the owner of the software. As a result of its ability to generate visually attractive and well-structured reports from a broad variety of data sources, the application is frequently used in businesses.
To facilitate straightforward analysis and decision-making, Crystal Reports offers a user-friendly interface for creating reports, integrating data, and formatting information.
The steps involved in the production of a Crystal report
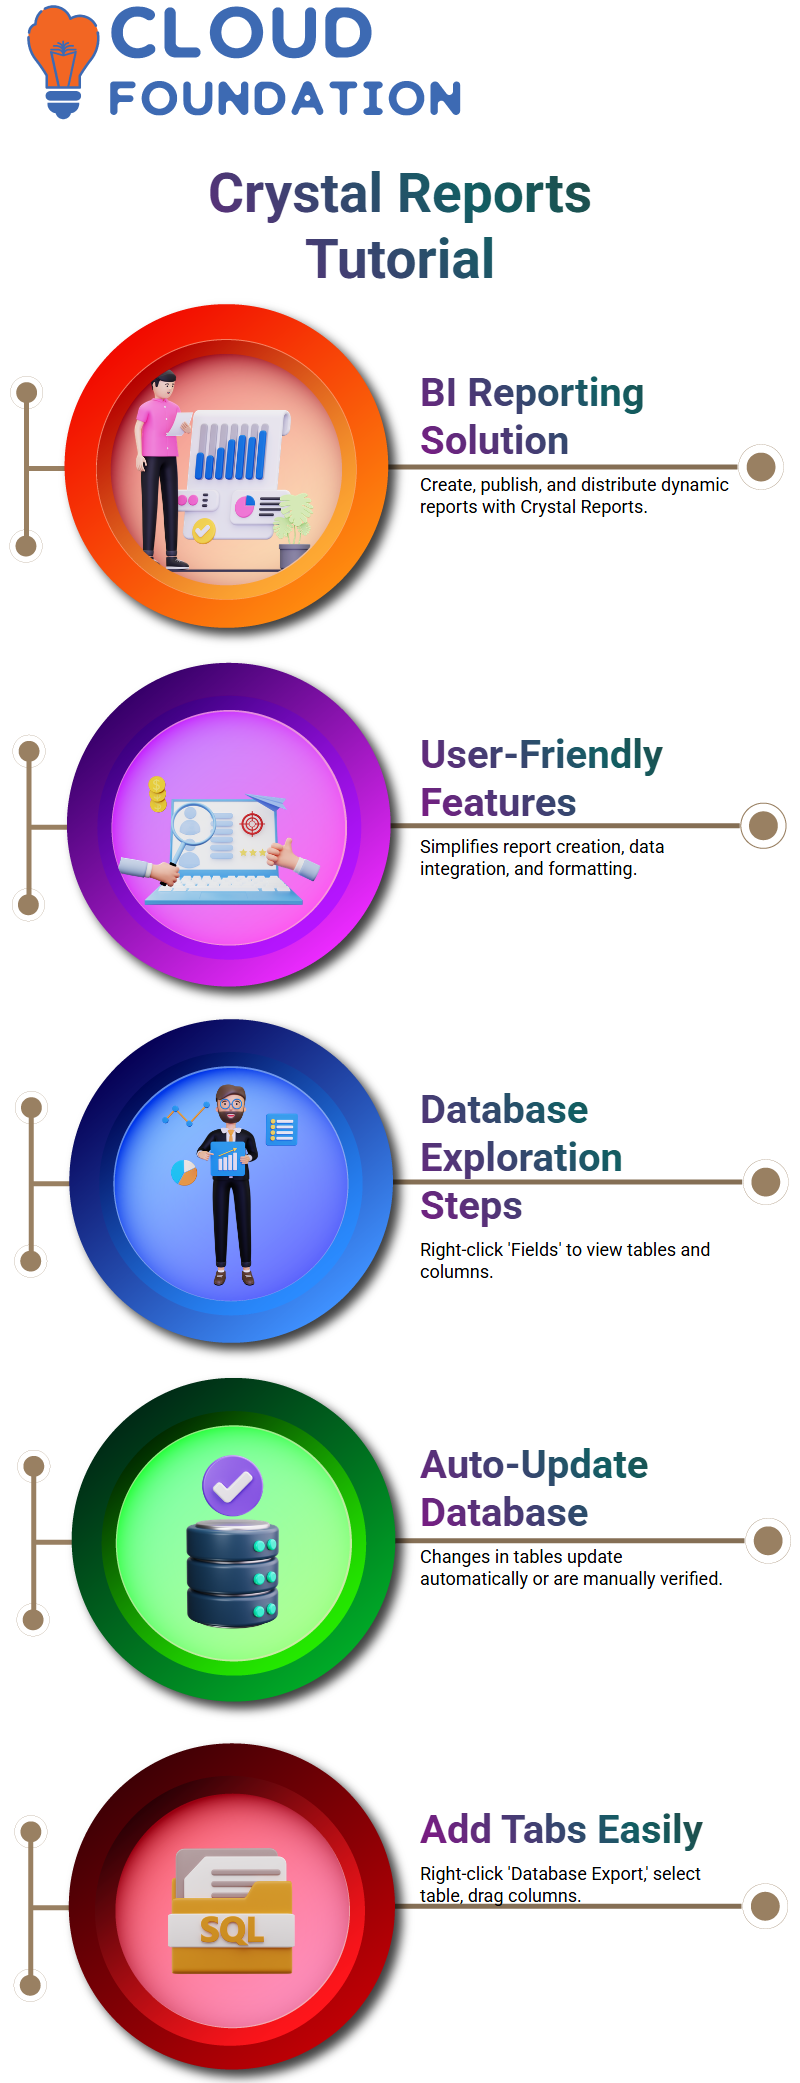
For the user to explore the database, they must right-click on the report and then pick “Fields.”
They are then able to examine the table and columns that are included in the product data set. Should any modifications be made to the table, the database will be immediately updated with the new information. If any modifications are performed manually, they will be checked.
Users may accomplish the addition of additional tabs to the report by right-clicking on the database and selecting “Database Export.” Afterward, they can choose the table and then drag the columns into the details.
When the column header is shown, the values of the columns will be repeated as many times as the rows that are present in the table.
Right-clicking on a report and inserting a text object are the steps to add style to the work.
Make the necessary adjustments to the font and phone size, then position the item in the center of the report.
The heading of the report may be customized by right-clicking on it, then choosing the font and size combination that you want to use.
It is possible to style the header as bold, and the dimensions of the phone may be raised from 10 to 12. For a more comprehensive view of the text, expand the header.
You may style column headers in a variety of ways, including choosing all of them at once or formatting each one separately by right-clicking on them.
As an additional option, you may select all of them at once and then right-click on one of them. An option to format numerous items is provided to choose from. By adjusting the dial to B, you may customize the phone tab. A report that is more visually attractive will be produced as a consequence of this approach.
The following actions need to be taken in order to show a Crystal report inside a Crystal report:
1. Include the Crystal report tag in the configuration file of the application.
2. In the user interface, set the policy to True at the same time as the policy itself.
3. To create an object of the report, use the name “Crystal report” in the user interface form.
4. Through the use of the following command, configure the data source for the C programme

Crystal Report Training
What is the significance of developing a Windows application?
A default form title needs to be included in the application with default settings. The form needs to be modified to prevent the most frequent mistakes and to optimize the state of the report window.
Make sure to follow these procedures to build a Crystal Report:
First, launch the program known as Visual Studio.
To access the “Sallyport” view, click on it.
Choose the “Create a new cursor report” option from the drop-down menu.
Fourth, make a whole new reports.
 Crystal Report viewer generated by using product reports
 Crystal Report viewer generated by using product reports
It is a stored method that is used to create the report, and the output is then filled into a data set that is referred to as a DS product. After that, the client receives the data, and the report that has been generated. After that, the report is seen on the document reader known as Crystal Report.
The user has the option of adding a picture, a new session, and a section to include a watermark in the report.
After that, the picture is loaded into the section, and the section expert is used to elevate the section that contains the image or watermark to a position that is higher than all of the other sections.
An upward Arrow is then used to advance the section expert to the next position. In the next step, the user may choose the portion that contains the picture or watermark and then click on the Watermark section.
A component called Watermark is included in the Crystal report. This area gives customers the ability to modify the width and height of a watermark so that it is suitable for their report.
However, depending on the size of the page, this may be accomplished using a variety of software programs, such as Photoshop. There is also the possibility of altering the report using picture editing software.
The Crystal report Watermark does, however, have certain restrictions related to its use. Adding lines to report header B, for instance, may result in a segment of the created report that is not visible to the user. In this regard, the report has certain shortcomings.
One approach to resolving this problem is to create a line that represents an element. It is possible to do this by drawing the element along a line that has certain width and height measurements.
Having said that, it is possible that this strategy is not appropriate for all users since it could not be appropriate for all circumstances.
Crystal Report’s sub-report creation
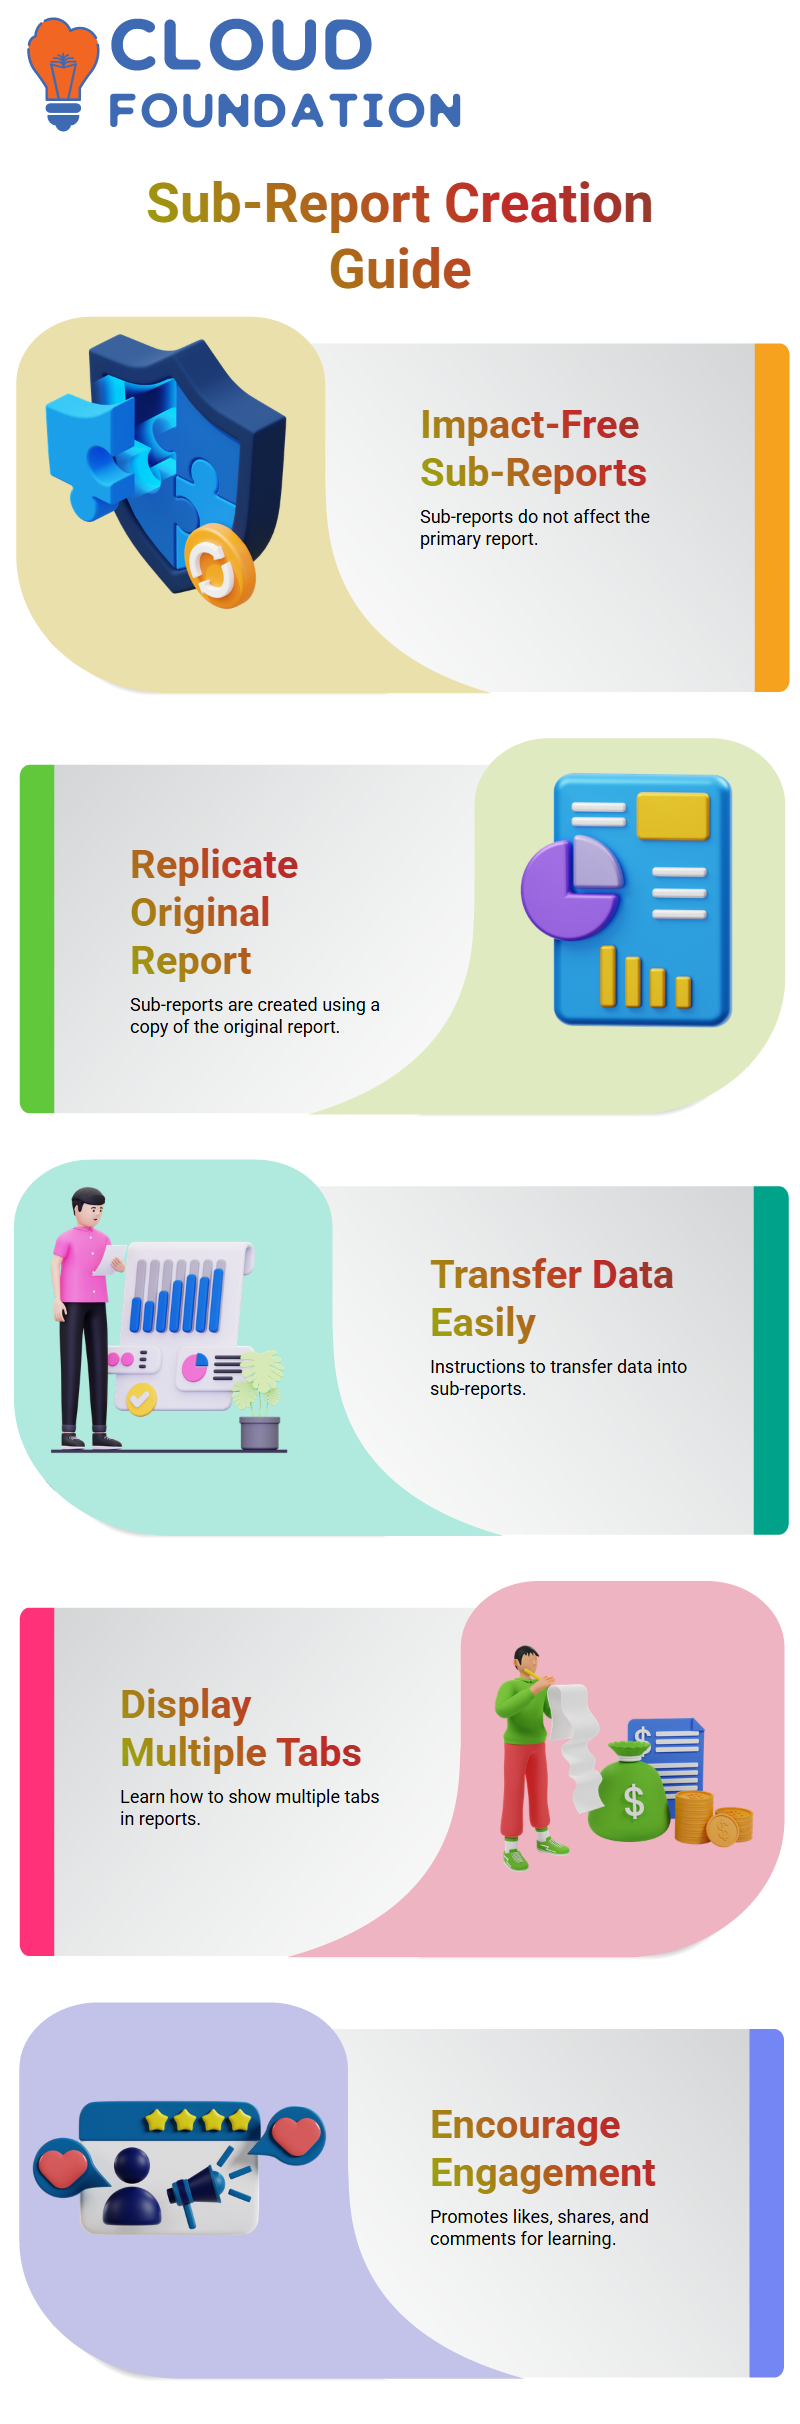
Specifically, it discusses the first and second ways of generating subreports, which will not have any impact on the primary report.
Because a copy of the original report is used to construct the sub-reports, any modifications that are made to the sub-reports will not have an effect on the original report.
The original report is replicated in the subreports that are included in the main report, as well as the subreports that are contained within the main report.

Crystal Report Online Training
Process to create a Crystal data set in Visual Studio
We have to create two files: one for the Visual Studio itself and another for the data set. Crystal is one of the new folders that is used in the creation of the report.
A technique that is used to make a product report is then used to generate the report. Following that, a new query and a new store process are used to build the report.
After that, the report is used to build a product report by making use of the shop that was selected.
After that, the report is presented in Visual Studio inside the folder that contains the data set directory.
The procedure in question continues to produce a product report by making use of the new data set and the store that was selected.
This procedure is repeated to build a fresh report by making use of the store that was provided.
Crystal report development utilizing project data folder
In addition to the report heading being included in the report, the data set is referred to as “X”. 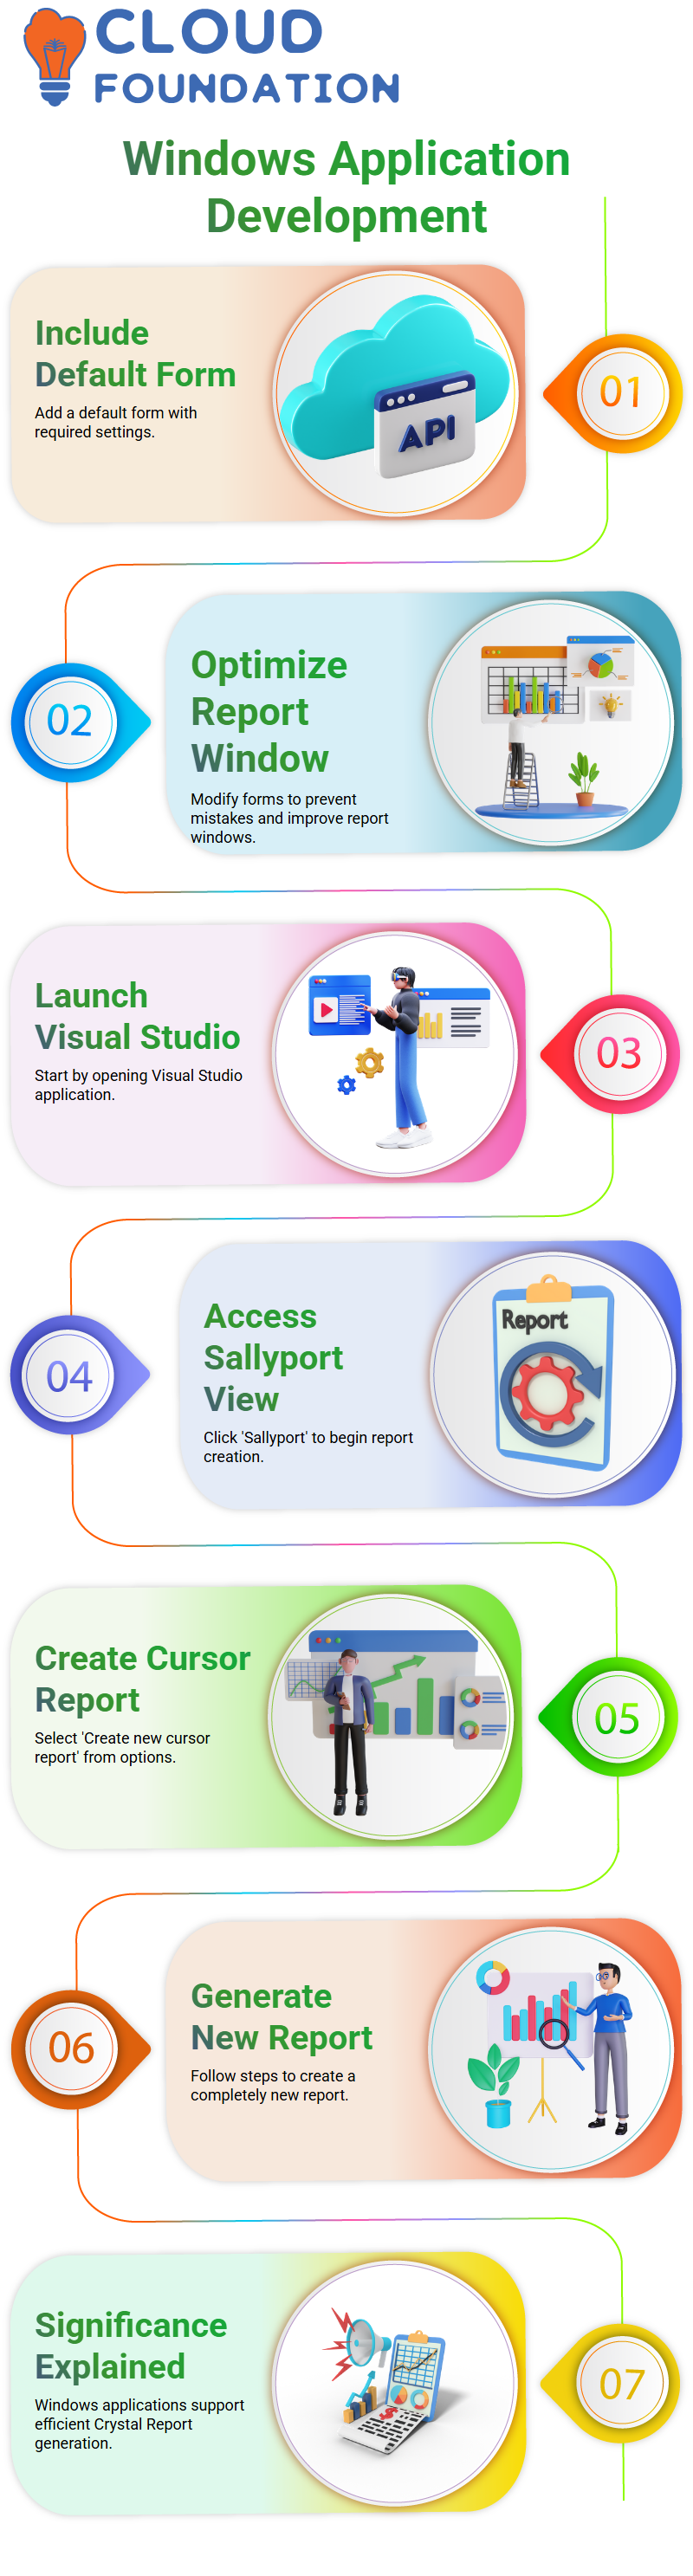 It is necessary to utilize a single Crystal report to include numerous tables into a single Crystal report. There are additional sub reports that are included in the report.
Following this, the sub-report is inserted into a new dialogue box, and the report is then opened.
The sub-report is referred to as “X Product,” and the table has been included. The report is then shown in the window that is designated for reports.
Actions to do to import a Crystal Report
A technique that involves importing a Crystal Report and providing the name of the store procedure as a second argument.
The store method is a product, and the report is a second parameter with the same meaning. In addition to the data adapter command being configured, the SQL connection object is also supplied as a second argument.
The declaration of the data set is followed by the filling of the result. After that, the information is sent into the Crystal Report object.
When the Crystal Report object is formed, the product is supplied as a new object to the Crystal Report object.
After that, the data is put on hold, and the table names are transferred from the data to the table name that is included inside the data.
In the next step, the data is copied and pasted, and the function that sets the data source is invoked.
Both the first table and the second table are passed for each product. The first table is passed over.
Afterward, the Crystal Report is positioned inside the Crystal Report view interface. In the subsequent step, the application is executed, and the start button is hit.
Methods for Using Data Frames in Crystal Reports
The procedure begins with reducing the width of the separating lines, followed by modifying the line thickness, and last, opening the report.
Following that, the subr eports are chosen, and the separation lines are modified. Following that, the film guides viewers through the process of formatting several items, selecting the ones with the least thickness, and adjusting the width.
Following this, the sub-report is increased, and the ultimate result is brought to a flawless state.
Crystal report creation utilizing a certain application
A critical source status is assigned to the report, and the user report is then generated. After that, the report is exported by clicking the export button, and the attributes of the crystal report are modified.
After that, the report is saved as a document, and an RPT product is generated automatically. After that, the report is filled into a data double report document that is written in C Sharp.
It is necessary to modify the parameters of the crystal report to export the report. Additionally, the export options and disk file must be assembled.
In addition to this, an objective save file dialog comes into being, and destination choices are also introduced.
When a report is exported as a PDF or Excel file, it is done so to save the file immediately. Choosing the file location and the file name may be accomplished via the usage of the save file dialog object filter.
A variable is used to save the file path and file name, and the report is then exported after going through this process.
There are a few processes involved in the process of developing and exporting the report. These steps include entering the data into the report, exporting the report, and configuring the attributes of the crystal report.

Crystal Report Course Price

Gayathri
Author
“Empowering Your Digital Journey with Insightful Expertise”