SAP BOBJ reporting training
How to Start Building SAP BOBJ Queries Now?
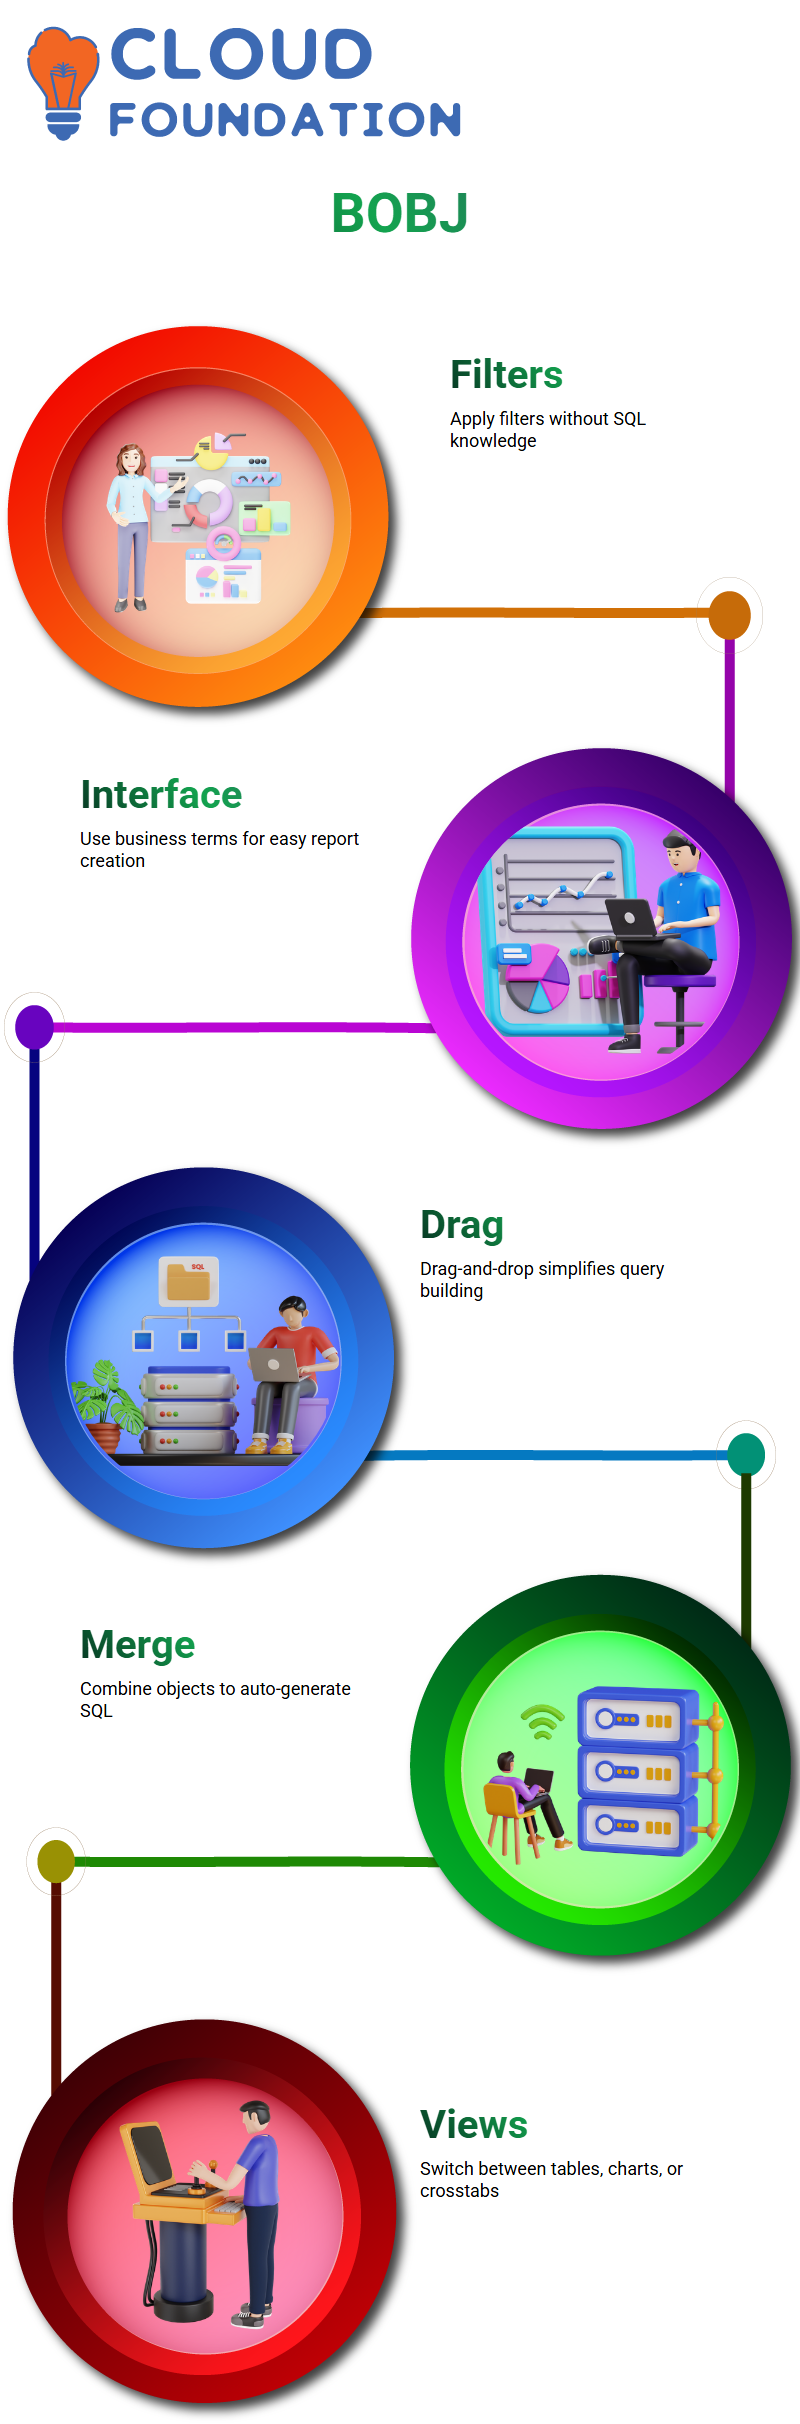
Focus is placed on query filters when creating reports with SAP BOBJ. For instance, if data from 2018 is needed, simply applying the year filter is sufficient—no SQL knowledge necessary.
What makes SAP BOBJ unique is its user-friendly interface; reports can be easily created using non-technical terms, such as ‘sales revenue’ or ‘state’, instead of complex database syntax.
Once SAP BOBJ is understood, there is no need to learn SQL queries to obtain answers. While some understanding helps, the drag-and-drop functionality makes the tool intuitive.
Much of the work involves merging objects in the universe panel; once combined, SAP BOBJ automatically transforms those business-language objects into SQL queries in the background.
SAP BOBJ defaults to table view, but it can be easily switched to charts or crosstabs if needed.
Queries provide answers to a wide range of business questions directly from the database—SAP BOBJ makes the interaction seamless: query the database and let the tool do the rest.
SAP BOBJ Universes and Data Sources
My data source of choice in SAP BOBJ is often a universe, which is created using either the Universe Design Tool or the Information Design Tool, resulting in either type.UNVor.UNX formats; both provide me with powerful reports.
SAP BOBJ makes selecting what I need simple – I can drag items from my query panel onto the “Result Objects” pane or filter by state for data specific to Canada. I can also use the “Query Filters” section if I require year-specific reports (such as 2020) or other particular requirements.
Navigating SAP BOBJ Query Panel
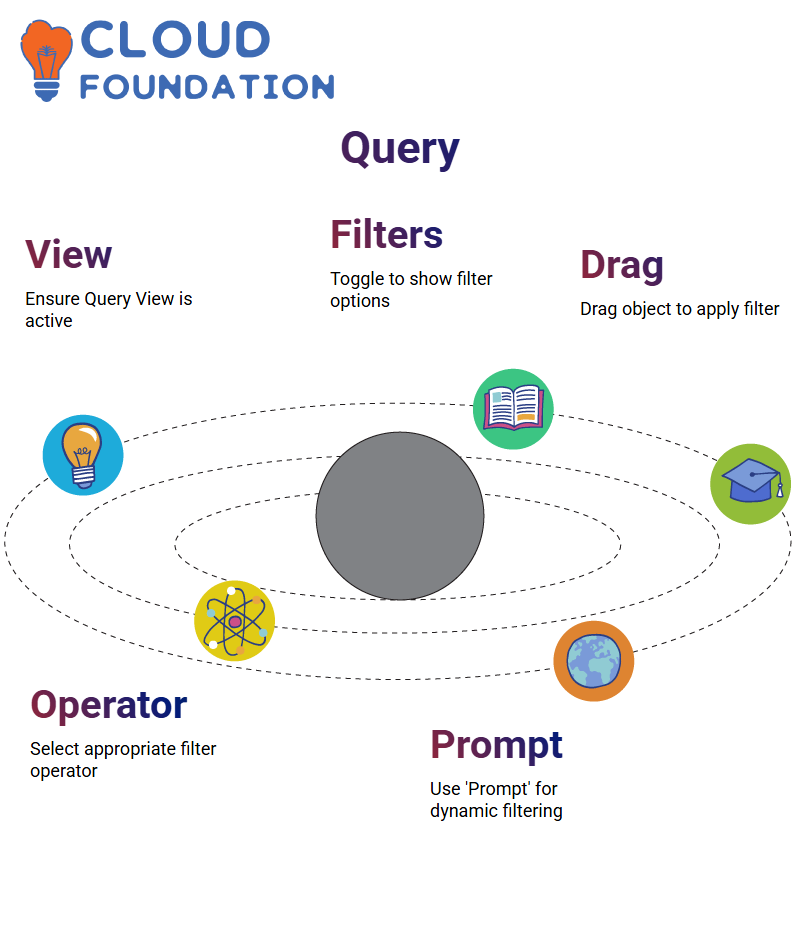
Before creating a prompt in SAP BOBJ, I first ensure I’m in Query View with filters visible (if they’re hidden, toggle the button), drag in the object I want filtered, select the operator, then ‘Prompt’ as a dynamic filter option to set dynamic filters up for immediate display in prompt form.
Filtering and Previewing in SAP BOBJ
SAP BOBJ allows me to preview data before running queries, which saves me time. Using scope of analysis filters, query filters, and document-level filters, I can quickly fine-tune reports based on specific requirements. For instance, if I only want information for the Asia region, I can instantly access the correct data for my needs.
Filtering in SAP BOBJ enhances performance by giving users exactly what they’re seeking. If a supervisor only manages data for Asia, I ensure their reports remain relevant and concise by using the filter pane to instantly apply state or region filters effortlessly.
Filters in SAP BOBJ
To quickly generate reports in SAP BOBJ, drag-and-drop the desired objects from the universe outline into the result objects–for example, ‘ sales revenue’ or’state.’
Additionally, document-level filters provide greater control and ensure that specific business questions are answered quickly and efficiently across all report tabs.
Filter Types and Query Processing in SAP BOBJ
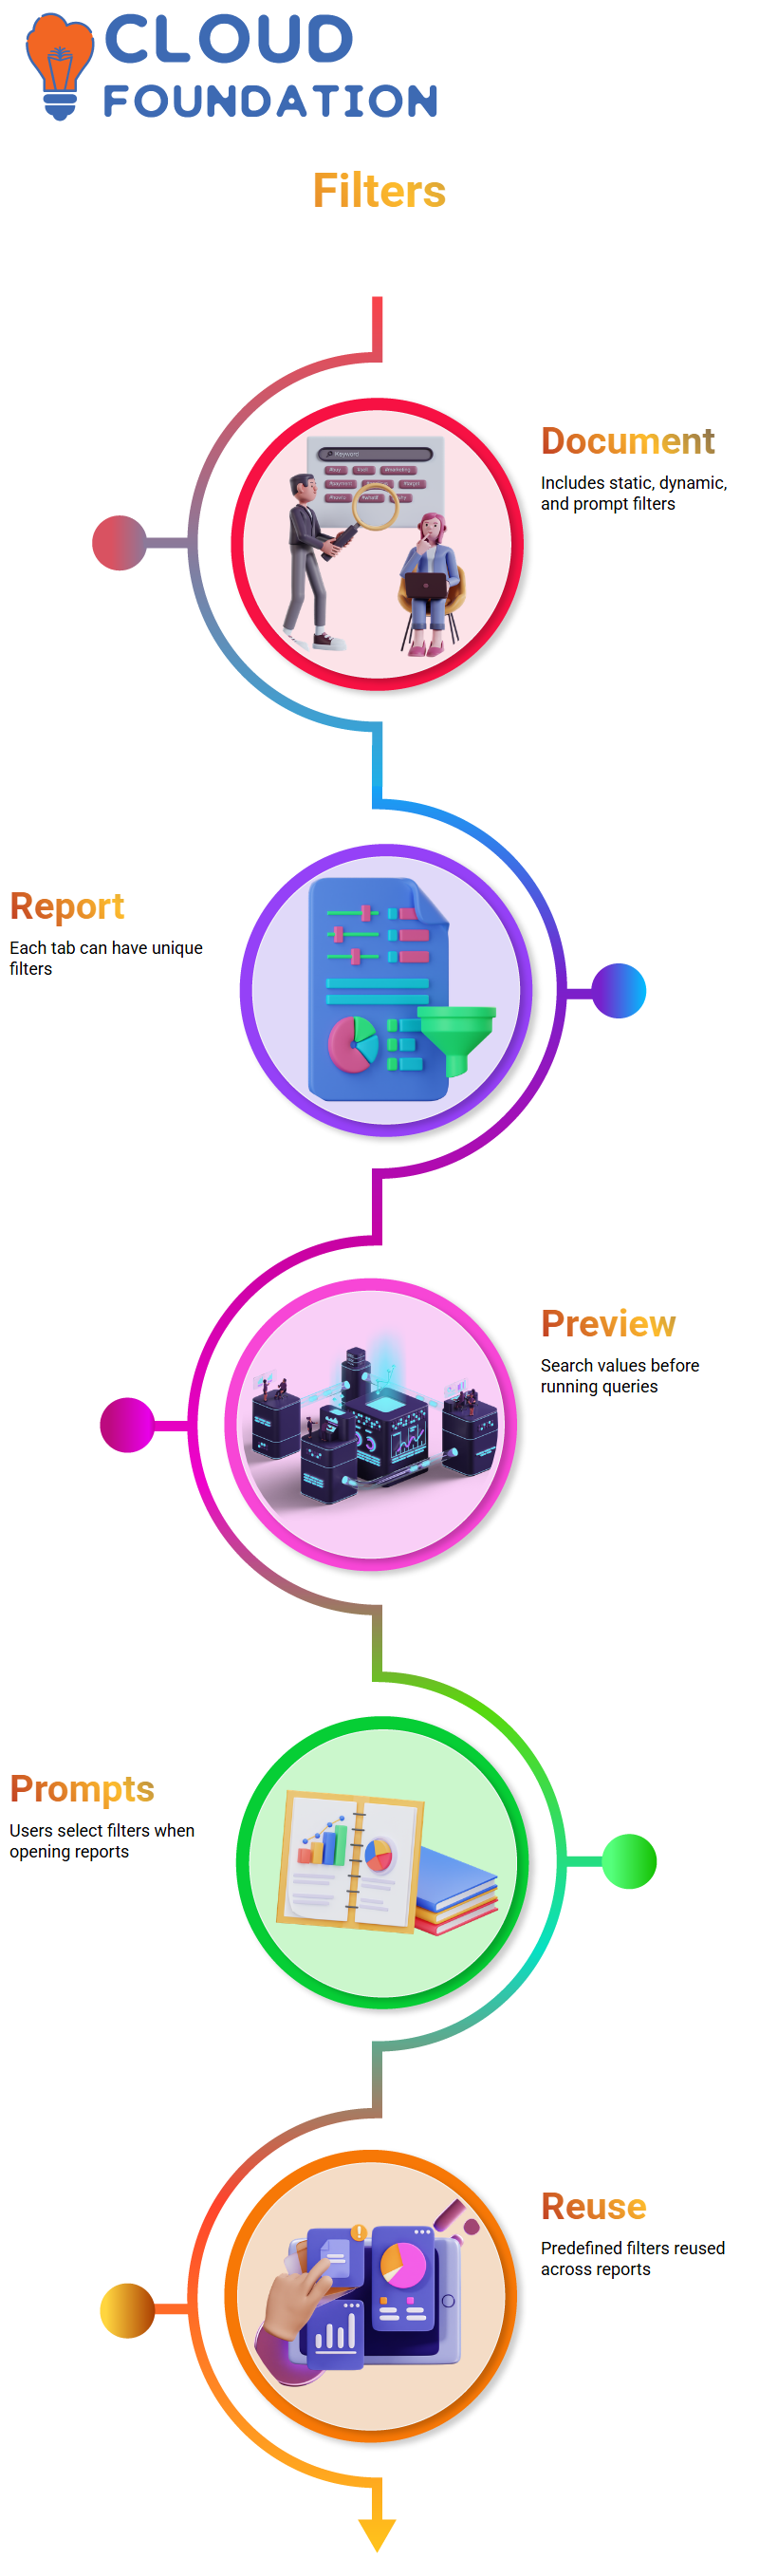
A deeper dive was taken into SAP BOBJ’s different layers of filtering. When adding query filters in SAP BOBJ, these fall under the document filter category, which encompasses static or dynamic filters, as well as prompts, all grouped under one umbrella term.
SAP BOBJ supports not only document filters but also report filters, meaning each report tab may present different data depending on its filter setup.
Report filters will be covered next, followed by an engaging lab activity using SAP BOBJ.
One explored feature was how to search within data samples using preview options.
Instead of scrolling line by line, preview options enable instant searching for specific values while simultaneously reviewing how SAP interprets access data—one of SAP BOBJ’s many practical capabilities.
Dynamic Filters and Prompts in SAP BOBJ
I occasionally need dynamic filters that users select when opening my report, using SAP BOBJ prompts so that they can choose, for instance, their region.
Asia Supervisors select Asia, while Europe supervisors can pick Europe, allowing a single report to work universally while still offering personalised data views.
Running reports in SAP BOBJ is effortless — only the output for this year’s data needs to be entered manually.
Yellow funnel icons represent predefined filters within SAP BOBJ that I often reuse across reports using the same universe.
SAP BOBJ Prompts
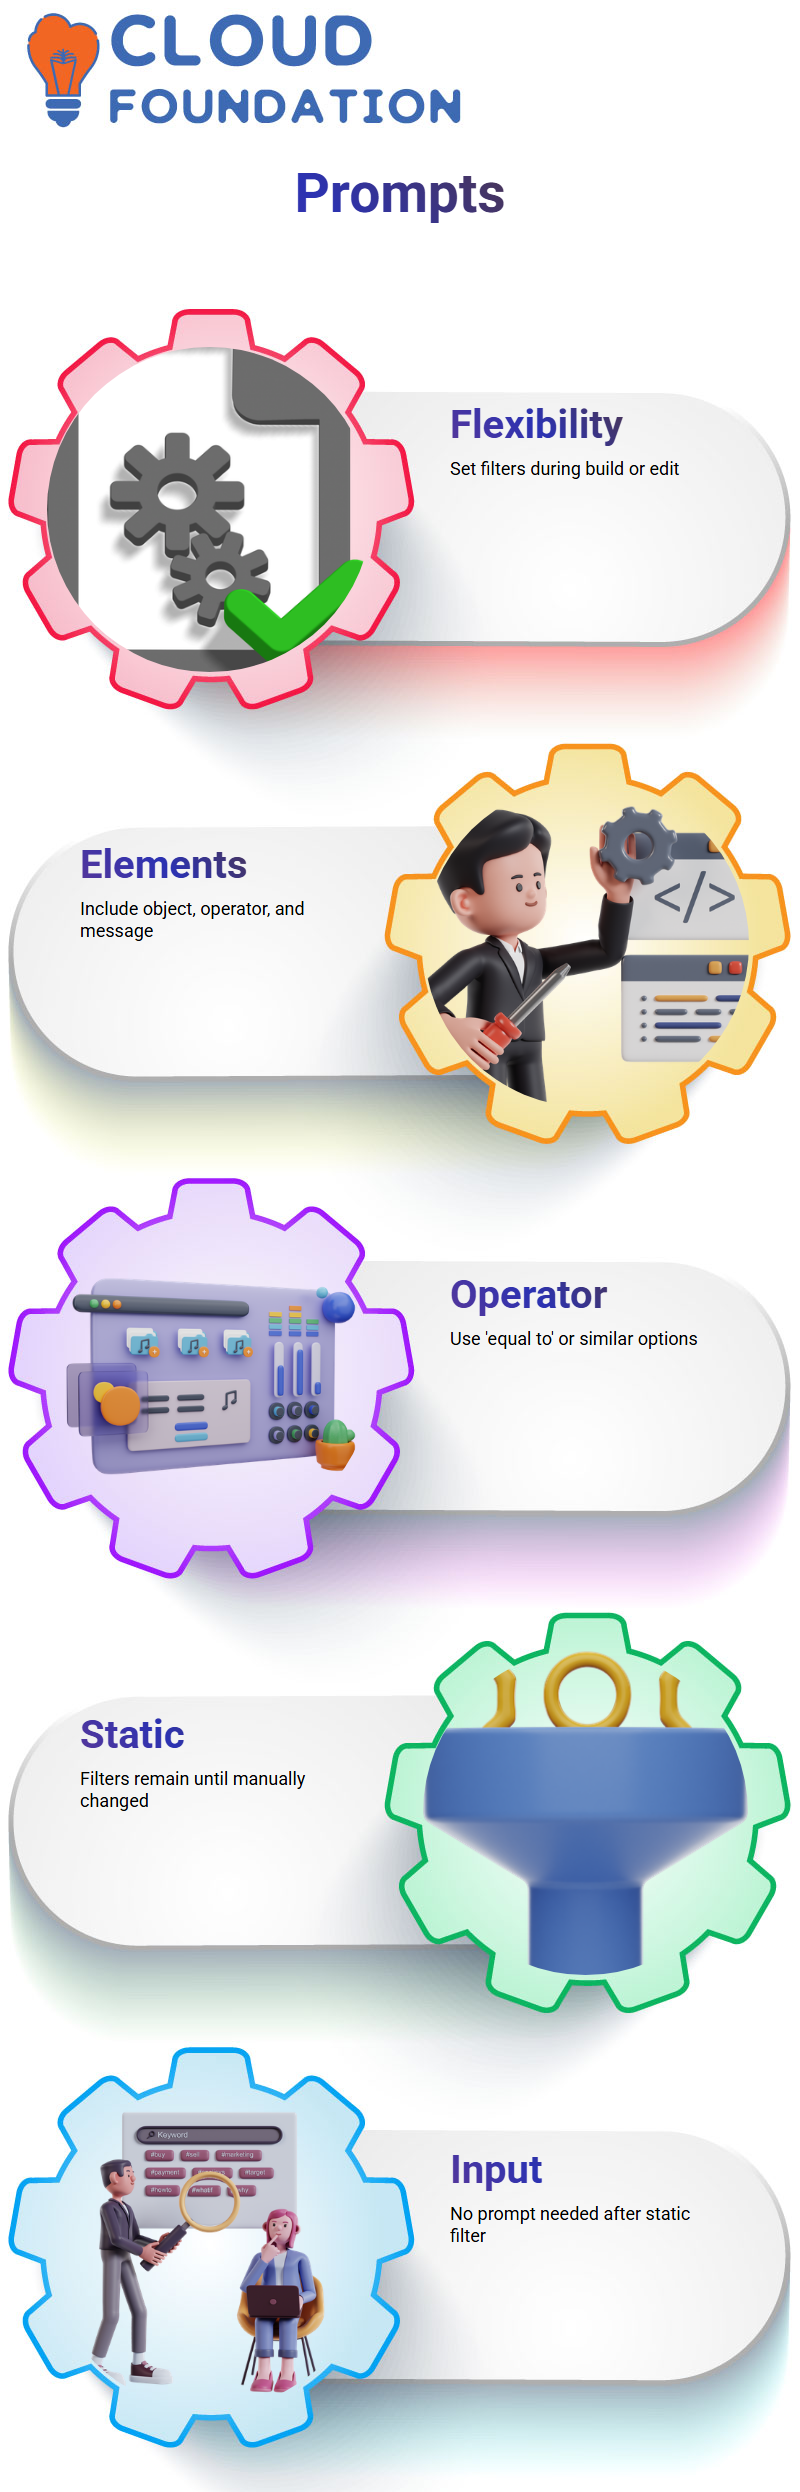
That Fit You Prompts provides me with the flexibility of setting filters while building or editing documents or universes.
I typically compose prompts by including three elements: a filter object, an operator (such as “equal to” or “not equal to”), and a custom message.
SAP BOBJ Prompts–Static Vs Dynamic
Static filters in SAP BOBJ don’t change until I modify the report; for example, selecting California would result in all subsequent reports showing its data without prompting for more input from me.

SAP Training
Multiple Prompts in SAP BOBJ
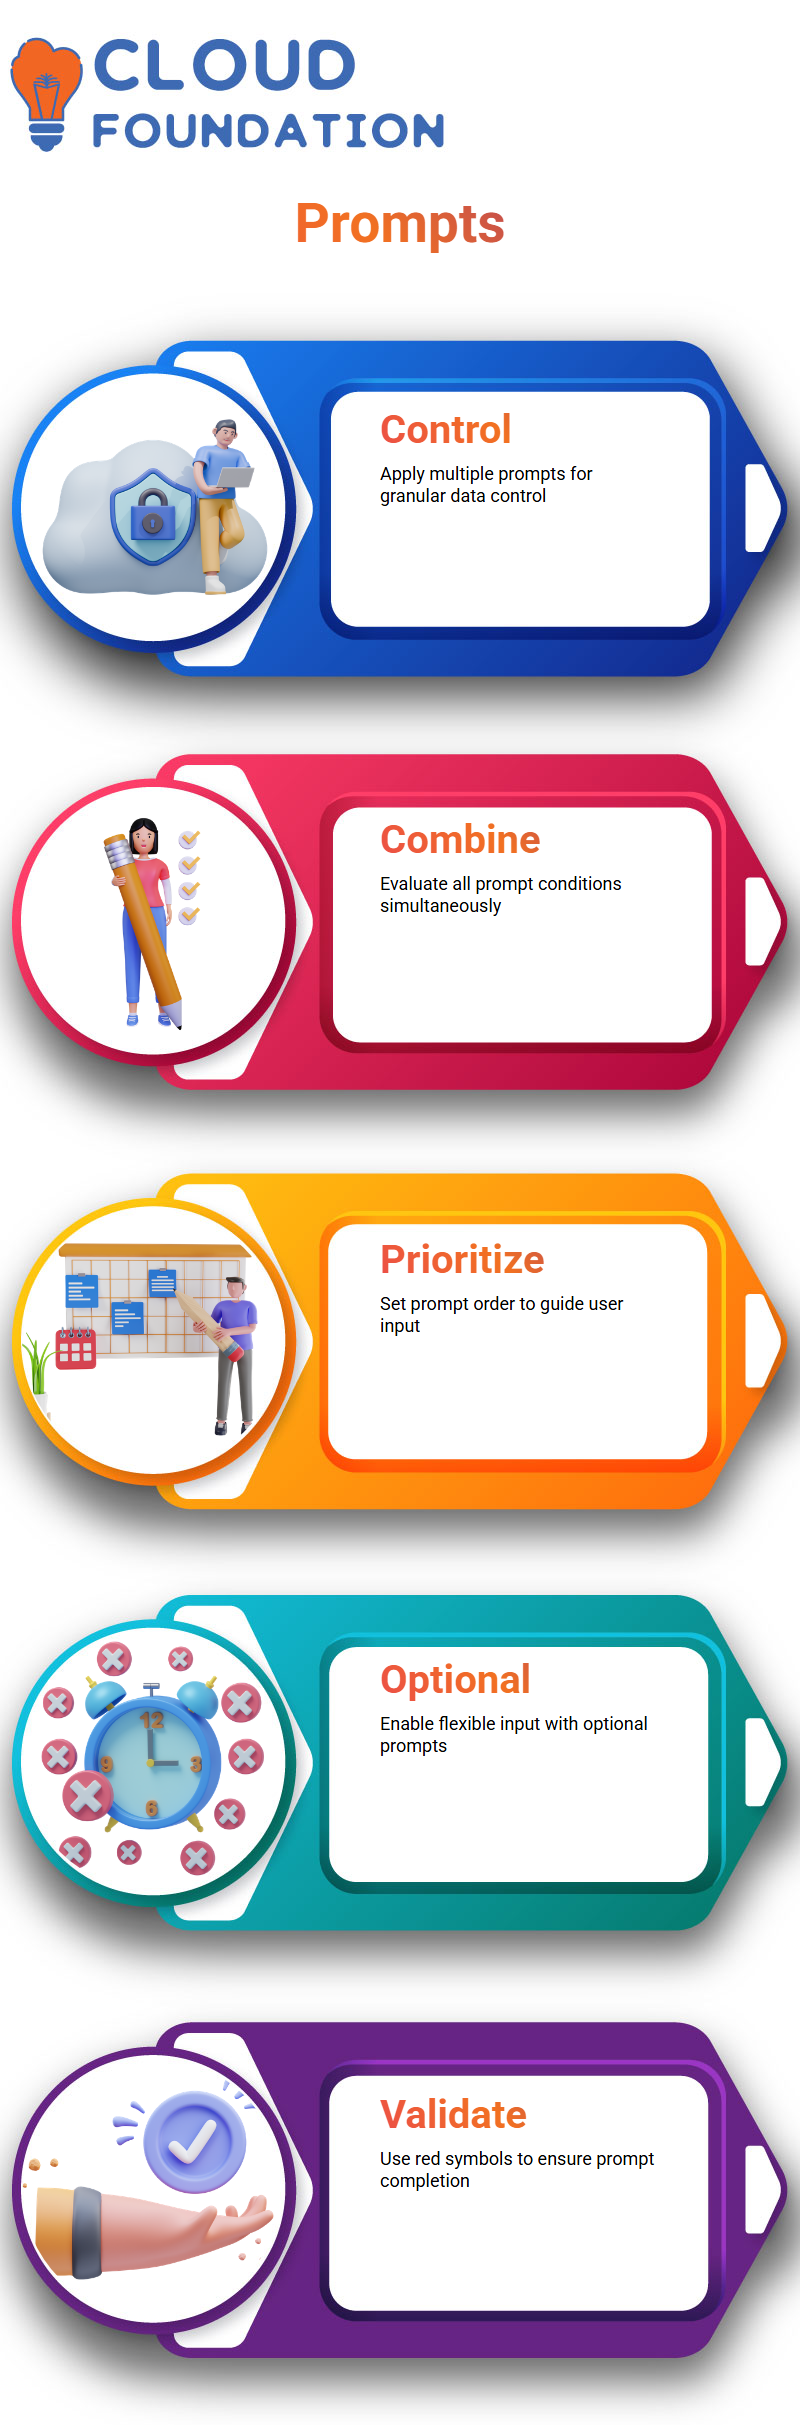
SAP BOBJ enables the application of multiple prompts within a single query, providing me with complete control over a dataset and offering users more granular control than before.
SAP BOBJ then evaluates all conditions together when combining prompts, creating reports with one result per prompt applied simultaneously.
SAP BOBJ allows me to prioritise prompts — for instance, placing “Year” above “State” —so users are guided on what information to enter first, improving the user experience and making reports more intuitive.
Prompt Properties in SAP BOBJ
I often adjust the prompt properties in SAP BOBJ according to how flexible I want the report to be.
For instance, by checking ‘Optional Prompt,’ users don’t need to enter any values, while unchecked prompt properties are indicated with red symbols to ensure reports can be run successfully.
Search and Optimise SAP BOBJ
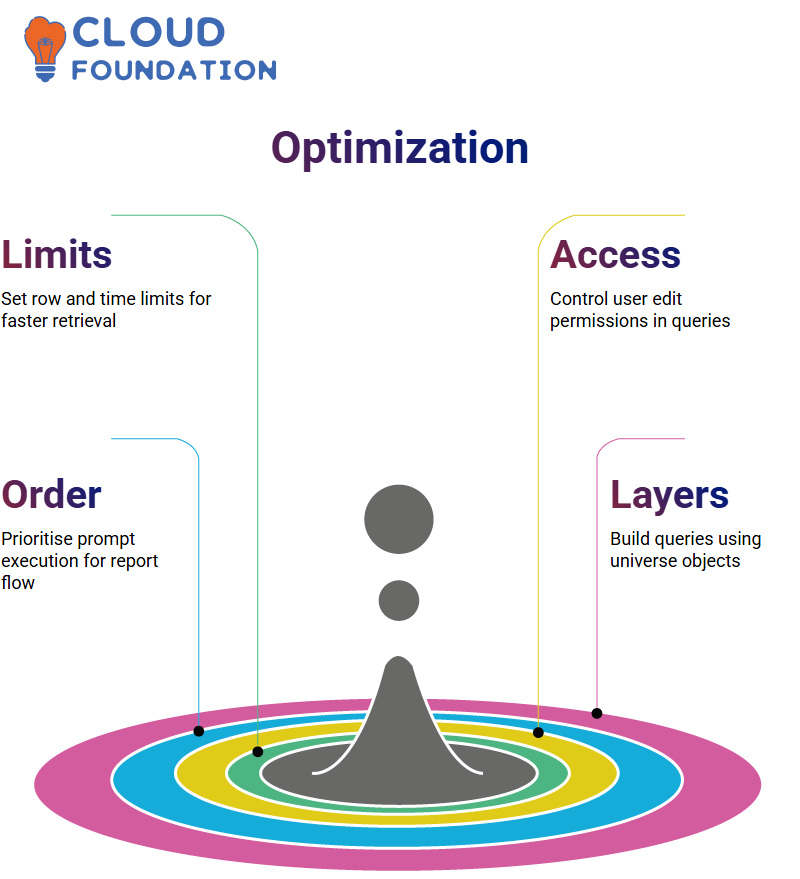
When working with large datasets in SAP BOBJ — millions of rows — I optimise retrieval by setting limits, such as maximum rows and fetch time, to avoid long wait times and enhance performance.
Furthermore, I manage options such as retrieving duplicate or empty rows based on specific needs.
SAP BOBJ security settings give me control of edit access. If other users should modify queries, I enable that feature; otherwise, I switch it off.
Prompt order is also valid: it allows me to prioritise which prompts run first (e.g. year before region), providing an orderly flow during report generation.
Report Layers in SAP BOBJ
In SAP BOBJ, the report layer is demonstrated by showing how to create queries from the query panel, utilising required objects from the universe to populate the query builder.
This includes adding filters or modifying settings to achieve maximum customisation options.
Imagine adding three objects and running a report, only to realise one was forgotten—no problem.
Return to Edit Data Access and adjust accordingly within the query panel; SAP BOBJ makes this adjustment process extremely intuitive.
Using SAP BOBJ’s refresh feature, results can be previewed to get a glimpse of how the data looks before running the whole query.
This preview helps validate the setup while identifying what might need alteration or the addition of filter objects within SAP BOBJ.
SAP BOBJ Reports Under Construction
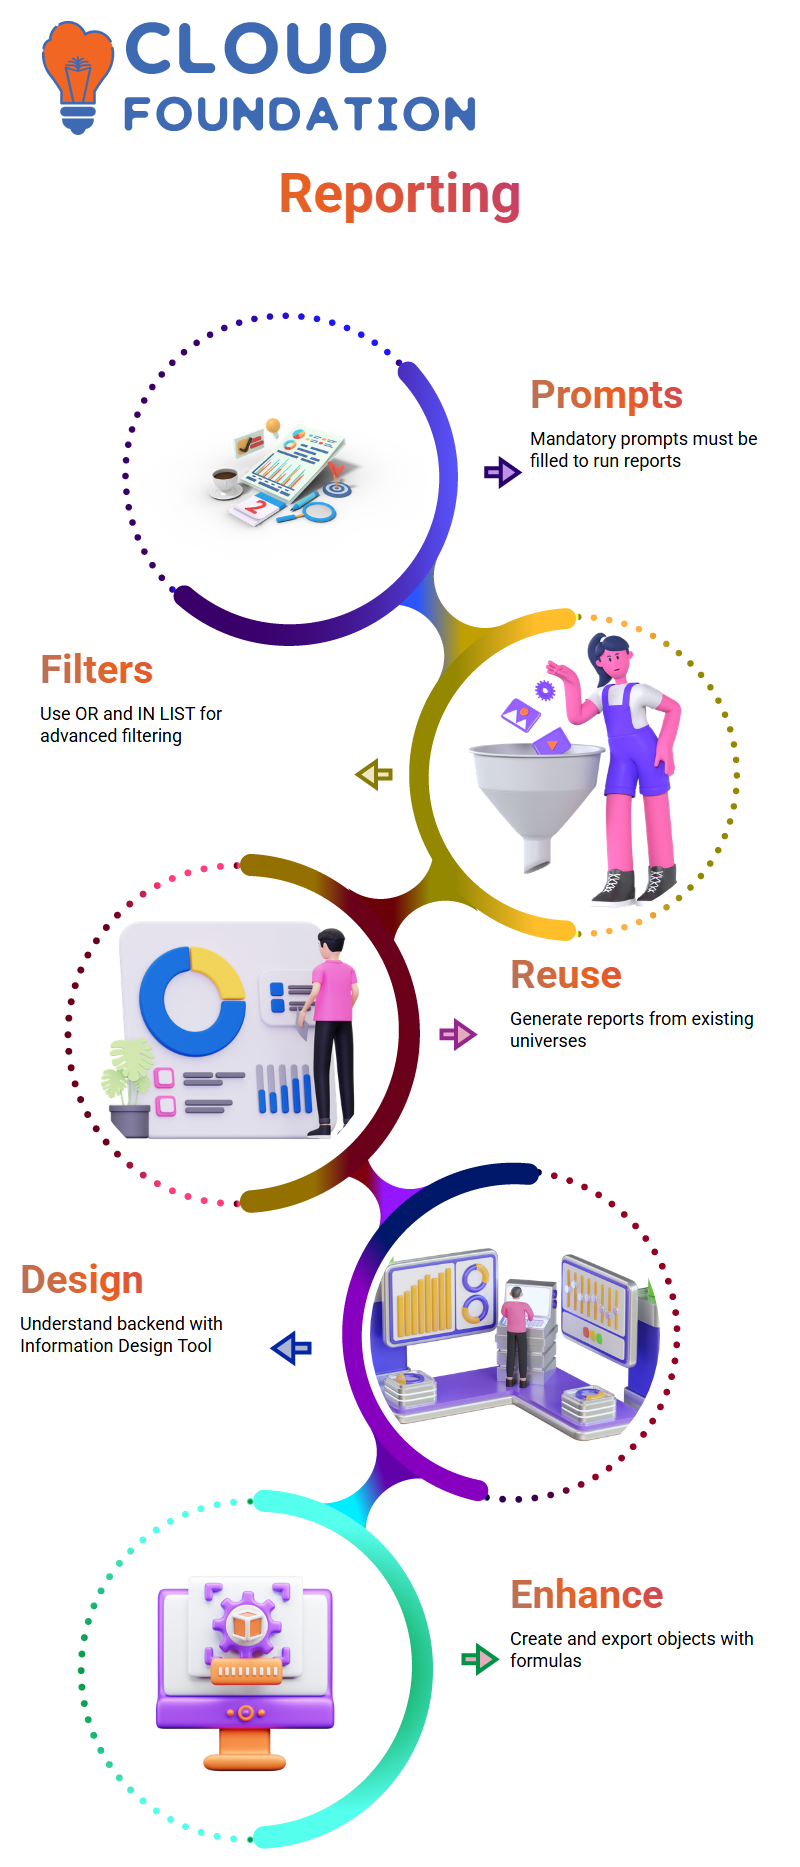
Once all prompts have been set in SAP BOBJ, I run my report in real-time. For mandatory prompts, the OK button remains disabled until a value has been entered. Once data is submitted successfully, however, its activation allows me to view my customised report.
SAP BOBJ supports advanced filters, such as OR and IN LIST, which I use to combine multiple conditions into a single output dataset. I often adjust these in the Query Panel before formatting reports further into tables or charts.
Building Reports and Universes in SAP BOBJ
SAP BOBJ allows for the reuse of universes. Once a universe is created, hundreds of reports can be generated from it depending on project requirements.
This eliminates the need to recreate universes each time, enabling users to proceed directly to reporting.
SAP BOBJ’s Information Design Tool helps users gain a solid grasp of the backend structure, including joined tables, created objects, and formulas used to transform data.
Even if users do not build universes themselves in a project, this understanding remains invaluable.
Enhancements in SAP BOBJ are managed efficiently. For example, when there is a request to create an object with a formula in a specific folder:
Log in to the Information Design Tool, right-click to create the object, add the formula, save, and export it for immediate use in reporting.
SAP BOBJ Half-Yearly Data for Reporting
Working with SAP BOBJ sales data often involves developing reports that go beyond traditional quarterly or yearly revenue summaries. One example focused on highlighting half-yearly sales revenue, which required some creative adjustments.
Quarterly data was converted into half-yearly dimensions using SAP BOBJ. A variable was created to categorise quarters 1–2 as H1 and quarters 3–4 as H2.
Since half-yearly indicators function more as labels than calculations, an IF formula was used to assign quarters accordingly within SAP BOBJ.
After creating a half-yearly dimension, it was applied to a report. Input controls, such as radio buttons, enabled selective filtering based on user needs—one of the features that makes SAP BOBJ both flexible and powerful.
The report is dynamically updated based on user selections, demonstrating the interactive and adaptable nature of SAP BOBJ reporting.
Working with SAP BOBJ sales data often involves developing reports that go beyond traditional quarterly or yearly revenue summaries.
One such example focused on highlighting half-yearly sales revenue, which required some creative adjustments.
To achieve this, quarterly data was converted into half-yearly dimensions using SAP BOBJ. A variable was created to categorise quarters 1–2 as H1 and quarters 3–4 as H2.
Since half-yearly indicators function more as labels than calculations, an IF formula was used to assign quarters accordingly within SAP BOBJ.
After creating a half-yearly dimension, it was applied to a report. Input controls, such as radio buttons, enabled selective filtering based on user needs—one of the features that makes SAP BOBJ both flexible and powerful.
The report is dynamically updated based on user selections, demonstrating the interactive and adaptable nature of SAP BOBJ reporting.
Advanced Report Writing with SAP BOBJ
When it comes to advanced report writing in SAP BOBJ, the use of logical functions, such as IF, can control how data is grouped.
This functionality is ideal for creating custom dimensions or altering calculation behaviour based on specific conditions.
SAP BOBJ showcases how conditional logic enables the creation of groups or labels based on an object’s value, allowing the construction of dimensions tailored to real-world user needs rather than relying solely on preexisting database elements.
Ranking and filtering capabilities in SAP BOBJ reports are also emphasised, particularly useful for focusing on top-performing entries (e.g., the top 10 sales regions or the bottom five states) at any given time.
SAP BOBJ ranks entries by measures such as sales revenue or quantity sold, rather than dimensions, providing dynamic insights into performance metrics.

SAP Online Training
Report-Level Variables in SAP BOBJ
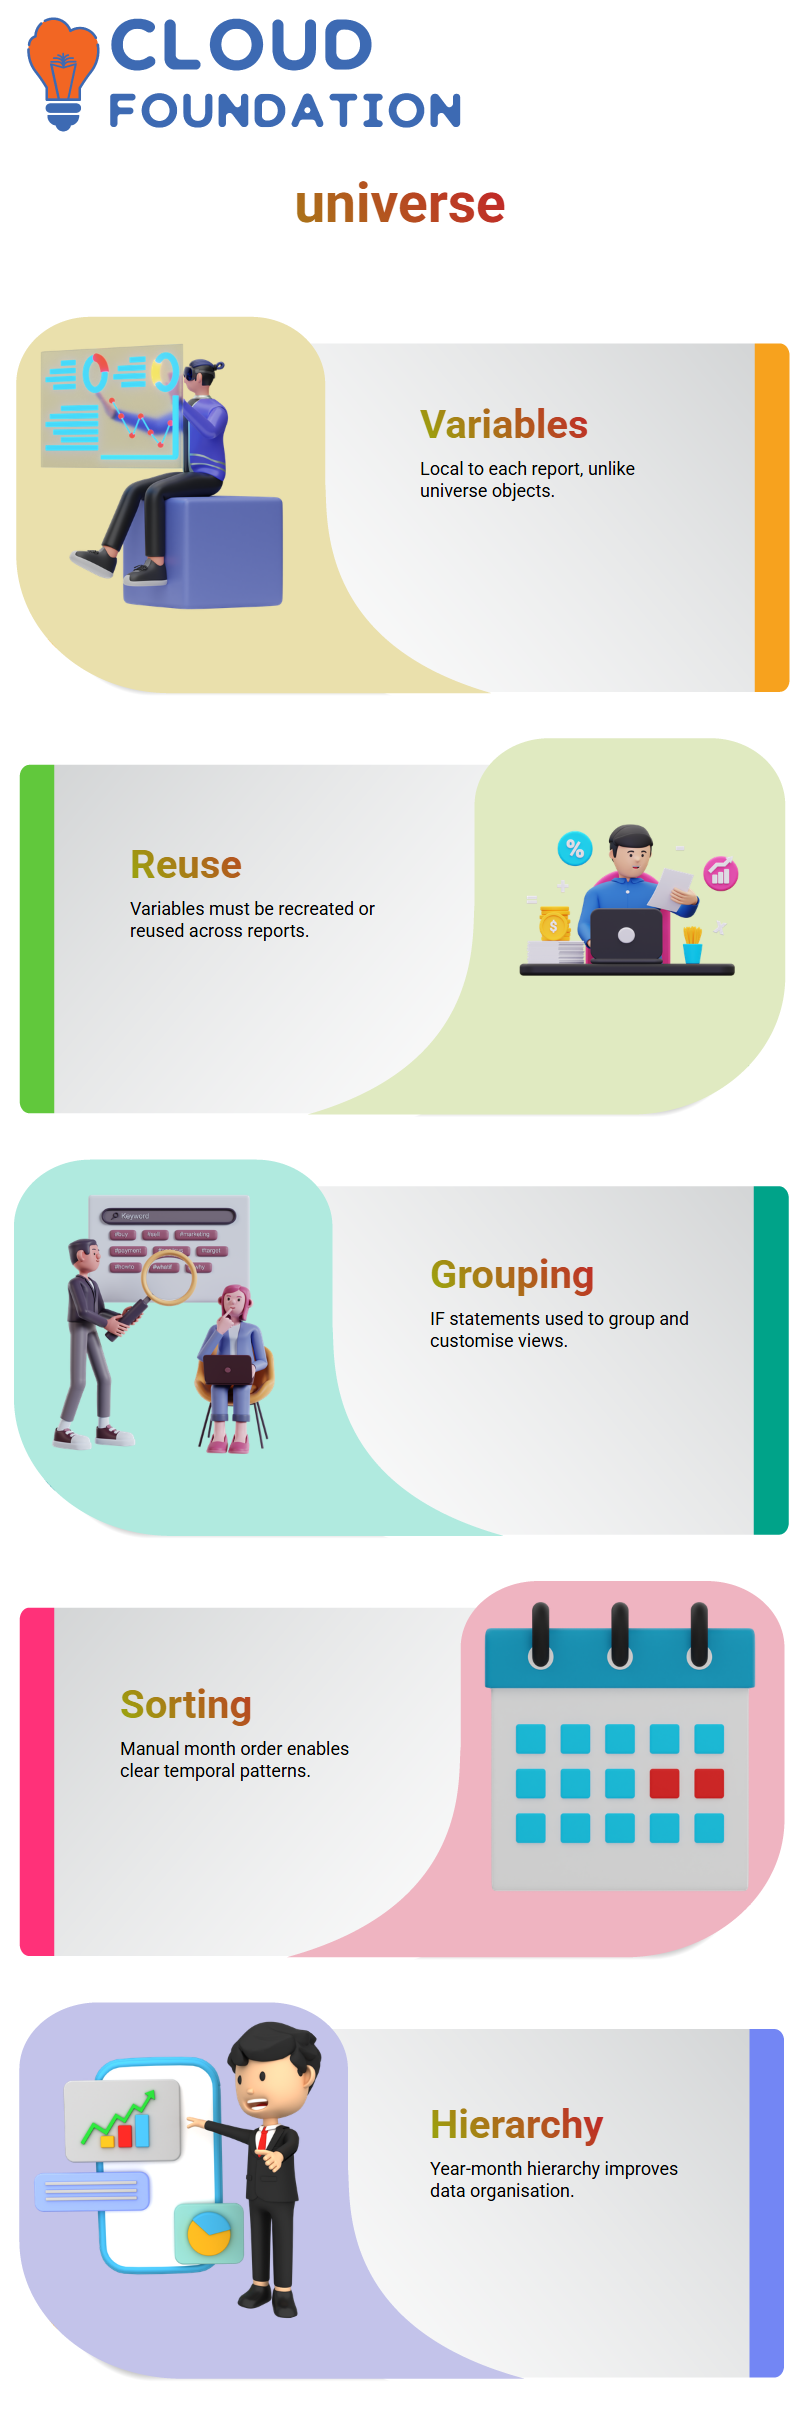
One key point emphasised is that variables created in SAP BOBJ are local to each report they belong to—unlike universe objects, which exist across reports.
This means that if the same functionality is needed elsewhere, variables must either be reused or recreated.
In this exercise, SAP BOBJ was used to group data using IF statements—an efficient way to manipulate and customise views without making changes directly to the database.
This method is especially beneficial when requirements differ significantly and do not necessitate changes to universe structures.
By leveraging SAP BOBJ’s robust formula support, quarterly revenue was intelligently grouped to present half-yearly views without overwhelming users with additional fields, such as quarters.
Filters still allow users to find exactly what they are searching for without requiring these extra fields.
Custom Sorting Options in SAP BOBJ Reports
After exploring half-yearly views in SAP BOBJ, the focus shifted to custom sorting in its advanced options.
Sorting by month names requires more than alphabetical ordering; therefore, months were manually ordered from January through December using advanced sorting options.
SAP BOBJ allowed the establishment of a hierarchy that neatly organised year and month data, such as 2019 appearing first with months sorted from January forward; all subsequent years followed suit thanks to these custom order configurations.
Sorting helps reveal seasonal and month-by-month fluctuations within data. Using SAP BOBJ made this type of visualisation particularly easy to navigate for users seeking to grasp temporal patterns quickly.
Ranking Functions in SAP BOBJ
A ranking requirement involved identifying the top 5 product clients based on quantity sold. SAP BOBJ provides an easy way to achieve this with its Ranking function—selecting the quantity measure within the report table to rank accordingly.
SAP BOBJ’s ranking tools are flexible enough to quickly identify clients driving high volumes, whether in terms of revenue, volume, or another custom indicator.
By using SAP BOBJ exclusively for ranking setup, all logic and sorting can be integrated directly into the report, eliminating the need for external manipulation and highlighting the advantage of working closely with data.
SAP BOBJ: Rankings based on Volume Sold
A ranking requirement involved identifying the top 5 product clients based on quantity sold. SAP BOBJ provides an easy way to achieve this with its Ranking function—selecting the quantity measure within the report table to rank accordingly.
SAP BOBJ’s ranking tools are flexible enough to quickly identify clients driving high volumes, whether in terms of revenue, volume, or another custom indicator.
By using SAP BOBJ exclusively for ranking setup, all logic and sorting can be integrated directly into the report, eliminating the need for external manipulation and highlighting the advantage of working closely with data.
SAP BOBJ Top and Bottom Product Analysis
After activating ranking, SAP BOBJ enabled quick and intuitive identification of the top five products based on quantity sold.
Excluded values, such as 1875, 1777, and 1963, were no longer part of the results, simplifying data visualisation.
Next, the process for selecting the bottom five entries using SAP BOBJ was demonstrated. Switching the ranking mode to “bottom” instantly retrieved these underperforming performers.
SAP BOBJ Rankings Presentation
To create visually engaging insights, SAP BOBJ formatting options were utilised to add blank rows and label sections, such as ‘Top 5’ and ‘Bottom 5’.
Bold styles with colour variations were applied for emphasis and adjustments. Finally, border tools were used to ensure a neat presentation of the data.
By copying styled cells and renaming them wherever needed, SAP BOBJ helps maintain consistency effortlessly.
Communication and Workflow to Support SAP BOBJ Practice
It was mentioned that an associated document should be sent to the HR and support mail ID as soon as possible; this will reinforce the discussion regarding SAP BOBJ report filters.
SAP BOBJ training will continue to be provided to support efficient learning and preparation for potential project opportunities. Appreciation is extended for the continued engagement throughout the SAP BOBJ training; the goal remains to support complete mastery of the tool.
Real World Examples in SAP BOBJ Projects
Real-world projects often utilize SAP BOBJ for multiple purposes—ranging from SAP BOBJ Universe objects to SAP BW objects—but what truly matters is understanding the system’s flow and architecture. Gaining both practical and theoretical knowledge through this tool is essential.
In one example, a team requested the creation of three new reporting flags in SAP BOBJ. Using the Information Design Tool and exporting to the repository for validation during development, these new flags became part of the SAP BOBJ reporting suite.
SAP BOBJ goes beyond drag-and-drop reporting, fostering skills in data logic, object creation, and manipulation, and providing data-driven insights. As a result, students are equipped to craft impactful reports using SAP BOBJ confidently.
SAP BOBJ Practice and Assignments
To create visually engaging insights, SAP BOBJ formatting options were utilised to add blank rows and label sections, such as ‘Top 5’ and ‘Bottom 5’.
Bold styles with colour variations were applied for emphasis and adjustments. Finally, border tools were used to ensure a neat presentation of the data.
By copying styled cells and renaming them wherever needed, SAP BOBJ helps maintain consistency effortlessly.

SAP Course Price

Navya Chandrika
Author