How to Track ROAS in Datorama Using Calculated Measurements?
Understanding Calculated Measurements in Datorama
Calculated Measures in Datorama can help simplify data delivery, offering flexible adaptation and editing to adjust as needed.
With multiple data sources contributing data from across Datorama’s system, combined with advanced calculations, these measurements are formed, allowing for adaptation or edits as required.
Calculated Measures in Datorama’s Calculated Measurements feature enable you to perform tasks such as calculating 25% of revenue or video costs, or determining the return on ad spend (ROAS) by simply dividing revenue by media cost, all expressed as percentages that facilitate efficient analysis of business or account-level performance.
How Calculated Measurements Work in Datorama
Datorama provides real-time calculations that adjust in real-time with changes to your native data, using logic operators and functions for measurement that reference both dimensions and other measurements to yield insights that bring value.
Datorama makes writing expressions for Calculated Measurements easy by providing access to ingredients and levels that define its granularity.
For instance, when trying to measure total conversion coverage, you can apply aggregate functions, such as the average, to evaluate the metric across various data streams.
Workspace-Level Integration in Datorama
Datorama Calculated Measures seamlessly integrate into your workspace, considering all relevant conversion tag data streams for analysis of your data.
This workspace-wide integration ensures accurate and thorough examination of your information.
Calculated Measures can add context to your reports by pairing native dimensions, such as media campaigns, sites, or creatives, with Calculated Metrics.
For instance, adding campaign names to pivot table views enables Datorama to adjust its query calculations to suit this new environment better.
Granularity and Aggregation in Datorama
Granularity and Aggregion are crucial in producing accurate measurements in Datorama’s Calculated Measures feature.
Granularity sets the context for calculations, assuring data analysis at its most in-depth level.
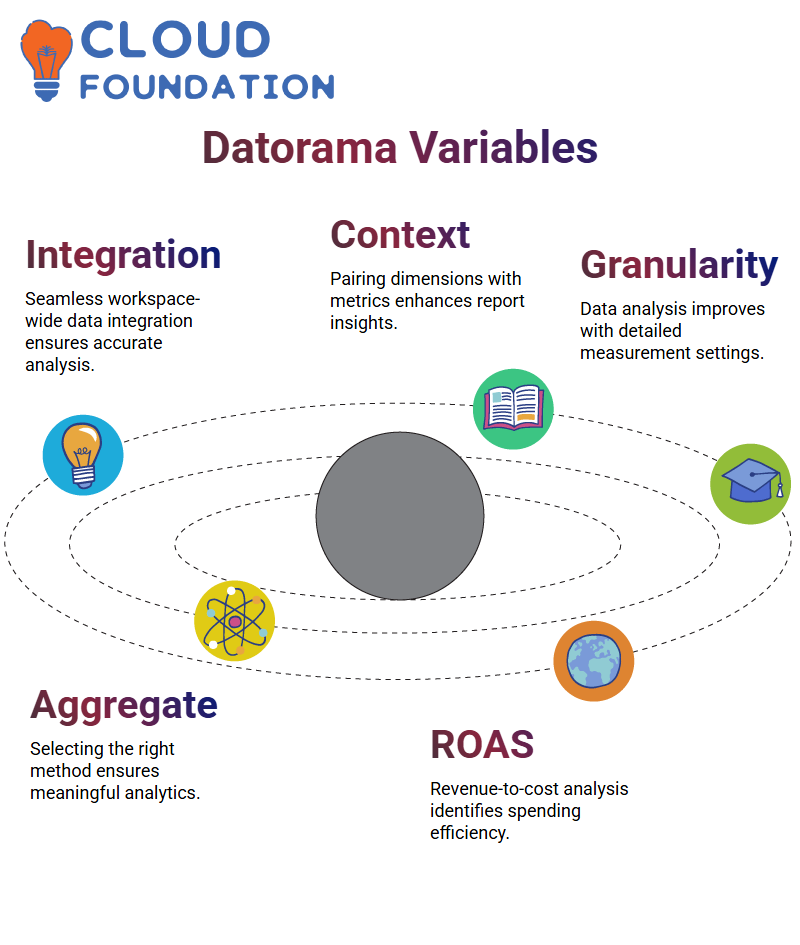
Selecting an effective aggregation method is equally crucial to effective data analytics.
Summing click data divided by impressions provides actionable insights without altering percentage-based metrics.
Use Case: Return on Ad Spend in Datorama
Calculated Measures in Datorama can help businesses measure return on ad spend (ROAS).
By dividing revenue by media cost, users can analyse how each dollar spent turns into gross revenue.
Datorama collects media cost data from sources such as Adform, Outbrain, and DoubleClick.
Revenue figures are sourced from Twitter Ads and DoubleClick Search ads, enabling them to provide insight into overspending or potential unrealised issues that might otherwise remain unexamined.
Understanding Calculated Measurements in Datorama
What calculated measurements in Datorama can make data analysis seamless and insightful?
If managing media costs from platforms like DoubleClick Campaign Manager, as well as revenue generated through ad placements, managing these datasets can feel disconnected.
Datorama seamlessly bridges this gap by offering calculated measurements that tie everything together.
Creating Your Calculated Measurements in Datorama
Datorama makes working easy from start to finish: navigate to Connect and Mix, Measurements, and Calculated Measurement.
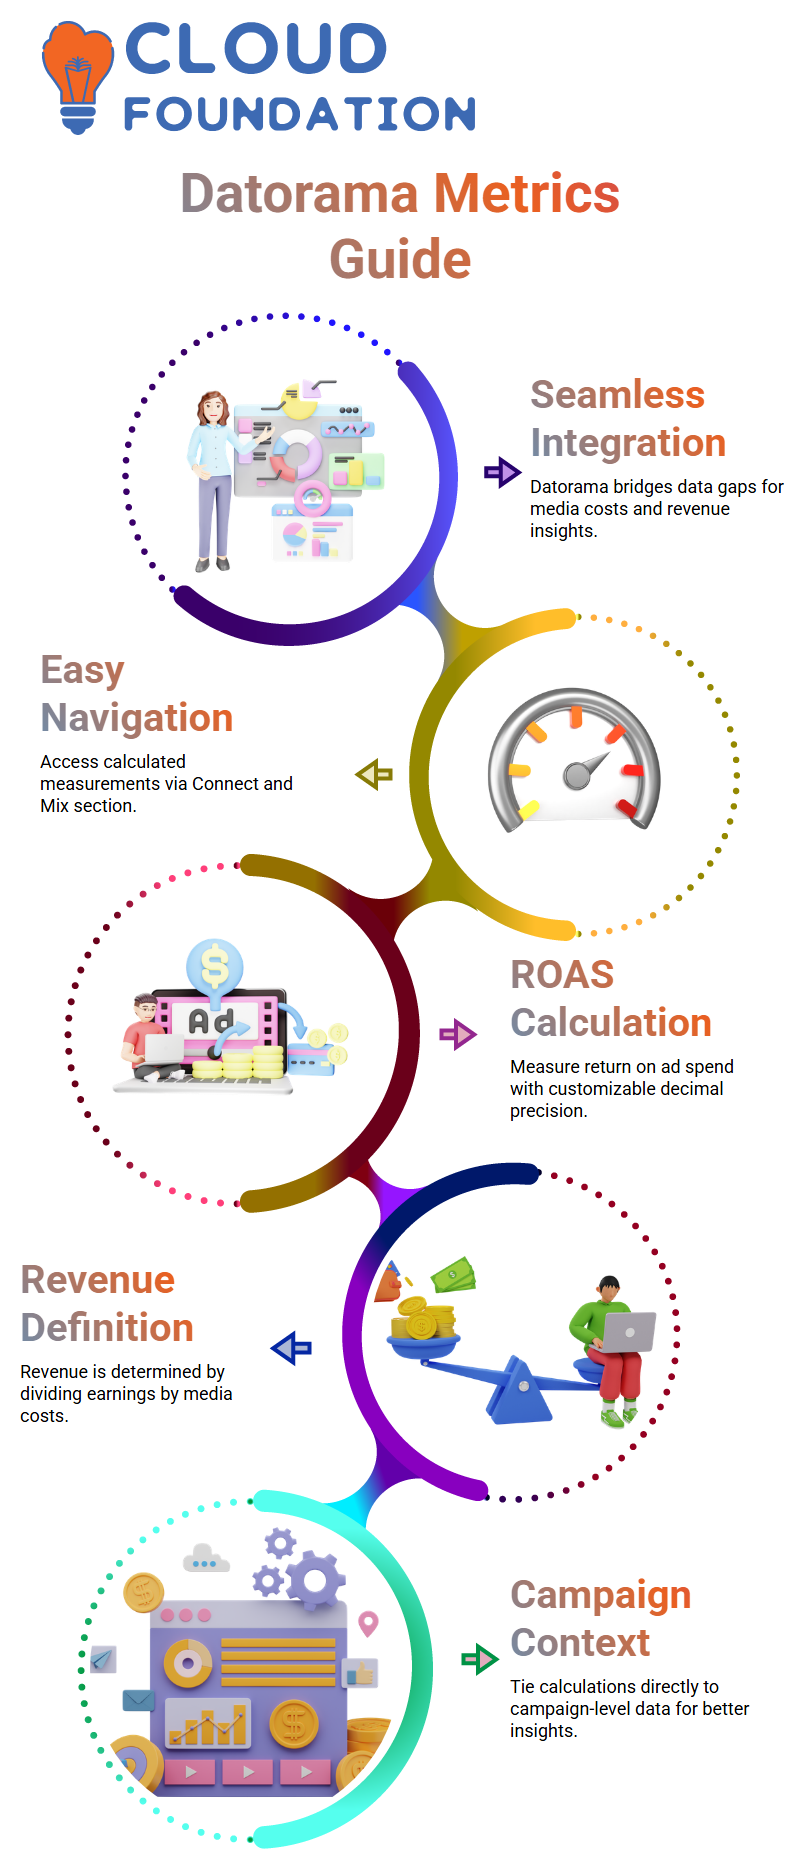
Named ROAS because its purpose is to measure return on ad spend based on percentage values, with two decimal places defined or as necessary, per your needs, allowing you to determine the decimal places accordingly.
Define revenue as the amount divided by the media cost. Datorama offers an advanced option that enables you to add greater precision.
Your calculations become highly contextualised when they utilise data tied directly to campaigns and campaign-level information.
Adding Granularity in Datorama
Granularity can make all the difference for Datorama users.
By applying it at the campaign key level, it provides insights into each campaign’s contribution to overall ad spend and revenue gains.
Additionally, ROS calculations reflect the performance of every individual campaign.
Trust me, this level of detail makes an enormous and impactful statement about Datorama’s capabilities.
Aggregation Functions in Datorama
Since ROAS is expressed as a percentage, you should select an average aggregation.
Datorama makes this step user-friendly, ensuring that your computed values remain accurate.
Once this step has been taken care of, use the Pivot Table option to verify calculations; it could save the day.
Using ROAS in Datorama
Datorama provides endless ways to utilise ROAS calculations.
Once calculated, you can integrate conversion tags, click-through rates (CTRs), heat maps, and top five ROAS visualisations into it for seamless data analysis.
Once ROAS measurements have been calculated, you’ll begin to see clear, actionable insights emerge from them.

Datorama Training
Understanding Datorama’s Interface
To access it, visit platform.datorama.com and log in. Once there, you will find three primary tabs: Connect and Mix, Analyse and Act, and Visualise, each offering different functionality that will become essential as you master Datorama’s platform.
Datorama also features a robust marketplace known as the Custom Marketplace, which offers pre-made connectors provided or partnered with Salesforce, providing meaningful solutions explicitly tailored for Datorama users.
Exploring the Datorama Marketplace
Datorama Marketplace offers endless potential, featuring helpful apps developed by Datorama, Salesforce, or third-party developers, many of which are applicable across their Marketing Cloud portfolio.
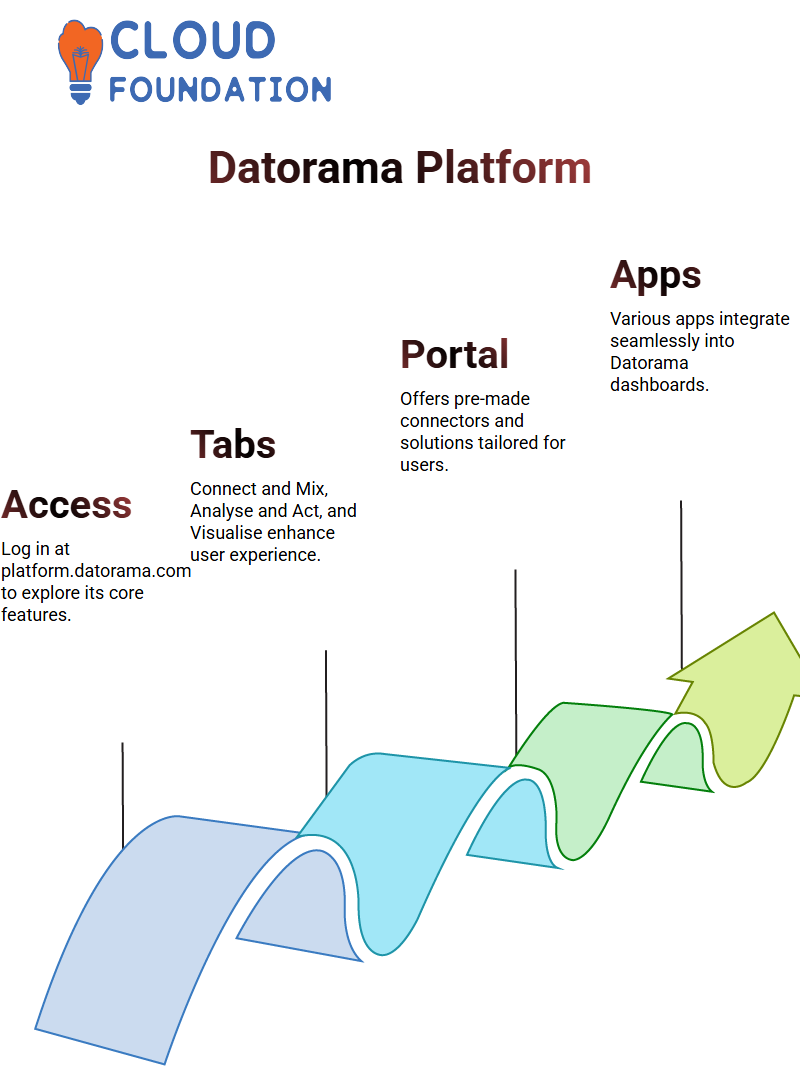
However, their true power lies in being used alongside Datorama dashboards.
Once installed, these apps seamlessly become additional pages within your dashboard.
From media-facing apps and customised visuals to free and premium apps, Datorama’s marketplace has something to meet any dashboarding need.
From free apps to premium ones, there is truly something available that will enhance the dashboarding experience for every person.
Mastering Datorama’s Connect and Mix
Connect and Mix is at the core of Datorama’s data ingestion process, offering easy ways for you to connect and integrate data streams.
Navigating to the left pane, you’ll see an assortment of streams ready to connect.
Total Connect is particularly well-suited for uploading flat files, such as CSVs, Excel sheets, or JSON documents.
Datorama supports numerous connectors, including Amazon S3, Redshift, and Google Drive.
Whatever database your organisation chooses to utilise, Datorama ensures seamless integration and up-to-date functionality.
Streamlining Data with Datorama’s Load Rules
Datorama’s Data Load Rules provide an advanced way to filter and organise data.
By working row by row, this feature enables you to eliminate unnecessary details while retaining only the essential information.
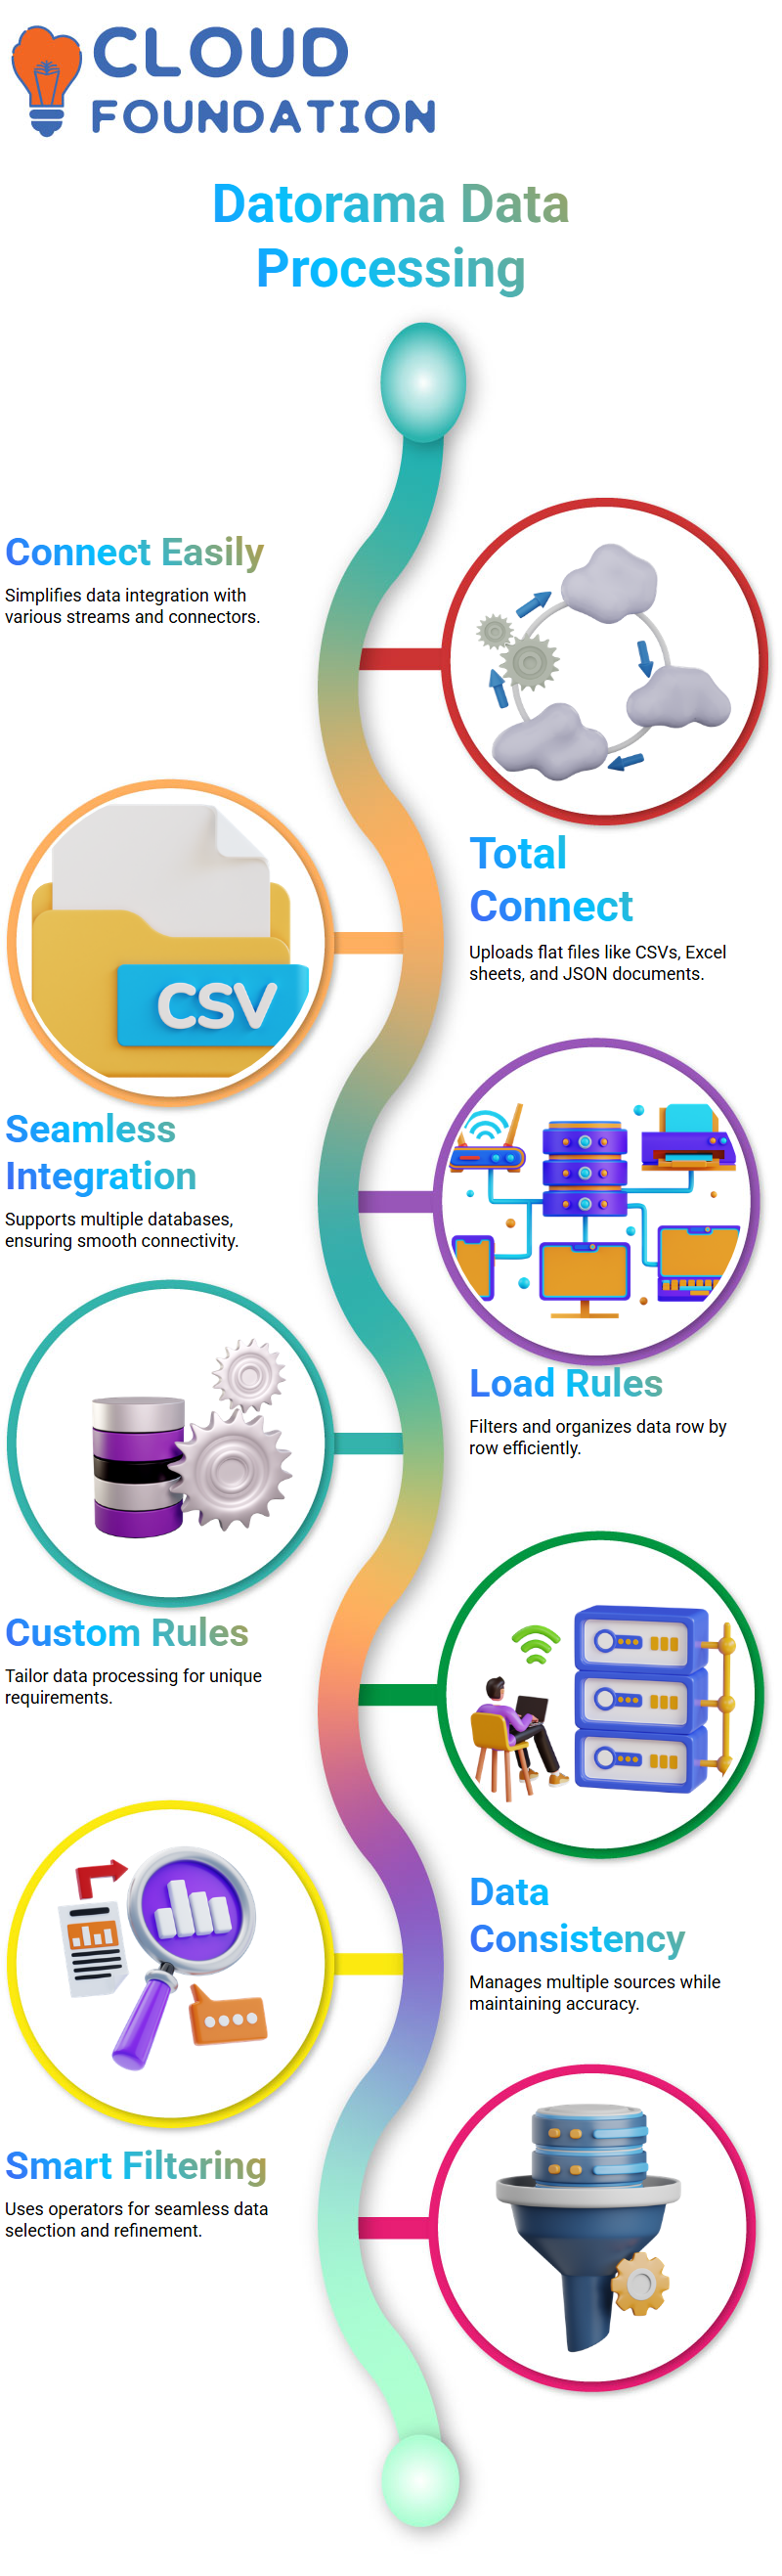
By creating specific rules, you can tailor your data to meet the unique requirements of your situation.
From managing multiple sources to maintaining data consistency, Datorama’s load rules make the entire process simpler than ever.
Simplifying Data with Datorama Operators
Datorama operators make life simpler. Their versatile nature helps make filtering data simple.
For instance, imagine needing information for some states within the US but not others.
Datorama operators help streamline this filtering process, allowing conditions to be applied seamlessly and with ease.
Creating Data Load Rules in Datorama
Data load rules in Datorama offer you an essential first step toward precision.
By creating them before generating data streams, these rules ensure that everything runs seamlessly during their creation process, and Datorama allows you to save them easily for future reference.
Tips for Naming Data Streams in Datorama
Sometimes, we forget to name data streams, and they may end up labelled Total Connect 1, etc.
If that happens to be you, too, taking an extra second to name data streams could go a long way in maintaining organisational order within Datorama.
Mapping Data in Datorama
External data appears on the left, while internal fields (the data model fields) appear on the right.
Through Datorama’s visualisation tool, it becomes efficient and straightforward to connect raw data columns to their relevant fields in your model, saving time and preventing mismatches.
Harnessing the Power of Harmonisation in Datorama
Datorama’s Harmonisation Centre is an invaluable asset for data classification and pattern recognition.
By segmenting your data using classification sheets and recognising patterns within your dataset, this powerful feature enables more structured and meaningful data classification, for instance, when categorising campaigns.
Using Patterns and Dimensions in Datorama
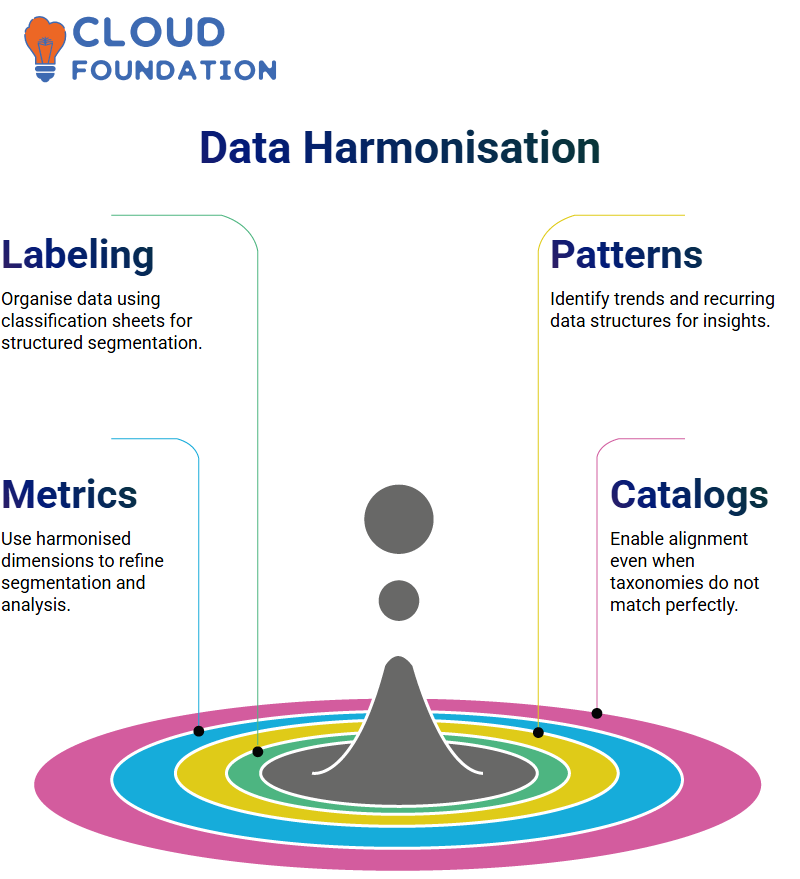
Patterns in Datorama enable you to identify trends and dimensions within your data.
Harmonised dimensions enable further segmentation for in-depth analysis, even where taxonomies may not match up properly with one another.
Datorama allows effective classification through manual setup.

Datorama Online Training
Understanding Patterns and Classification in Datorama
Datorama offers flexibility in creating patterns and classifications, simplifying the task of maintaining uniformity during campaigns.
For instance, consider an existing structure that defines Q4, Q3, and Q1 positions, but one campaign doesn’t align perfectly.
Instead of creating new patterns immediately, tweaking or making necessary modifications are better ways to harmonise these inconsistencies effectively.
Using Datorama offers this capability effectively.
Datorama makes classification easy by pairing patterns and classifications seamlessly together.
When 50% or less of your campaigns match specific patterns and the remaining follow another, creating a classification sheet could prove extremely valuable in ensuring alignment and functionality across campaigns that may otherwise deviate.
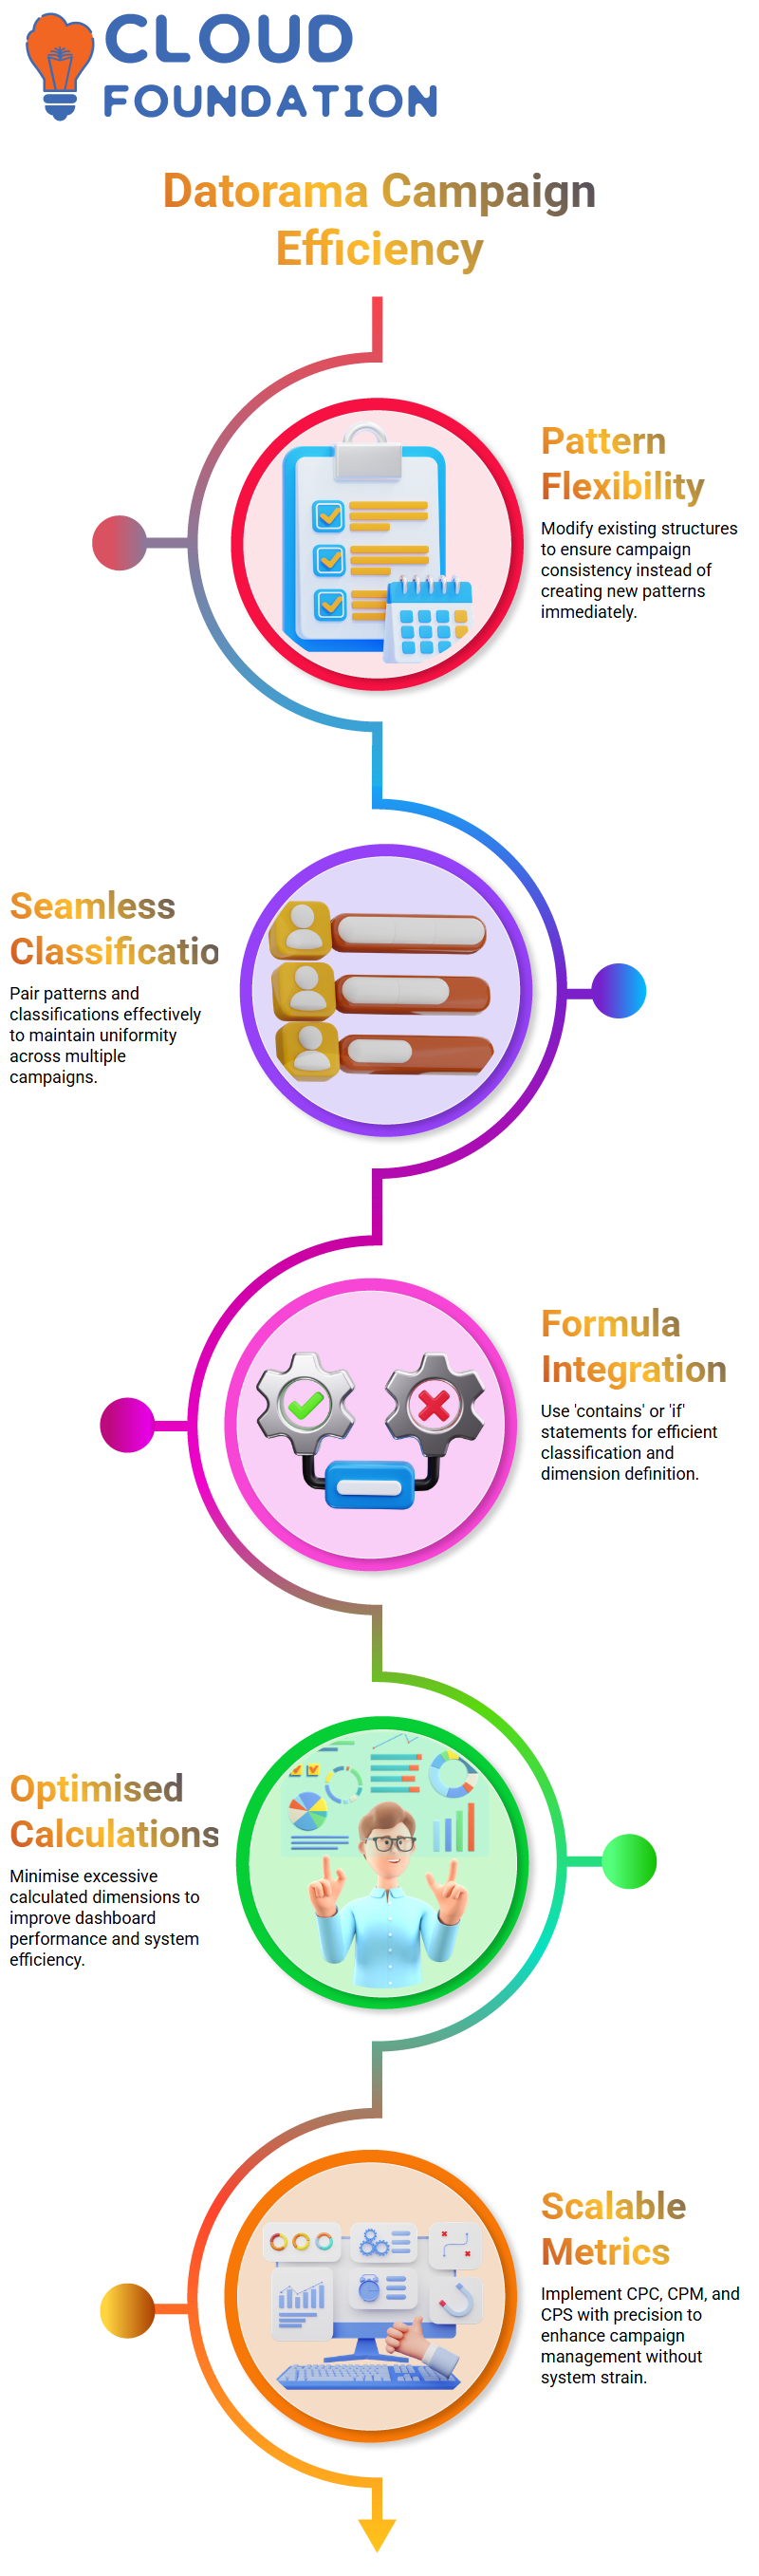
Datorama stands out with its capacity to use formulae, such as ‘contains’ or ‘if’ statements, to define dimensions efficiently while managing both classified and unclassified campaigns effectively.
Harnessing Calculated Dimensions and Measurements in Datorama
Calculated dimensions are one of Datorama’s most valuable tools, making formulae and elements quick to define.
Overusing calculated dimensions may slow dashboard load times, so optimise efficiency while alleviating system strain.
If using hundreds of calculated dimensions is part of your project, I advise adopting alternative, scalable strategies instead.
However, computed dimensions remain valuable tools for specific tasks.
Datorama recognises the significance of calculated measurements alongside calculated dimensions as essential components to campaign management success.
Standard calculated metrics used include CPC, CPM, and CPS measurements, which require precise application without overburdening your system.
Adopting scalable methodologies remains key to managing campaigns efficiently in Datorama.
Exploring the Media Transparency Centre in Datorama
Datorama’s Media Transparency Centre is an eye-opener.
This feature is particularly intriguing, as it allows me to compare planned data against actual data using tools such as Prisma to bring in planned numbers and compare them against deliberate numbers from DCM or DV360.
At the ad placement level, this comparison assesses whether campaigns performed as planned.
The Media Transparency Centre not only offers insights into planned vs actual data but also aids campaign management and optimisation efforts, providing users with tools for understanding gaps and taking appropriate measures to meet campaign objectives.
Unlocking Einstein Marketing Insights in Datorama
Datorama Einstein Marketing Insights are truly impressive. Their AI-powered bots analyse real-time data, offering direction based on key performance indicators (KPIs).
Set filters and receive updates on metrics that indicate changes over time, helping me uncover trends more deeply for actionable insights.
Einstein Marketing Insights stands out to me because it helps direct attention toward areas that may need focus, rather than offering fixed conclusions.
Its main benefit lies more in directionality and exploration than in definitive analysis, making it an indispensable asset in Datorama campaigns.
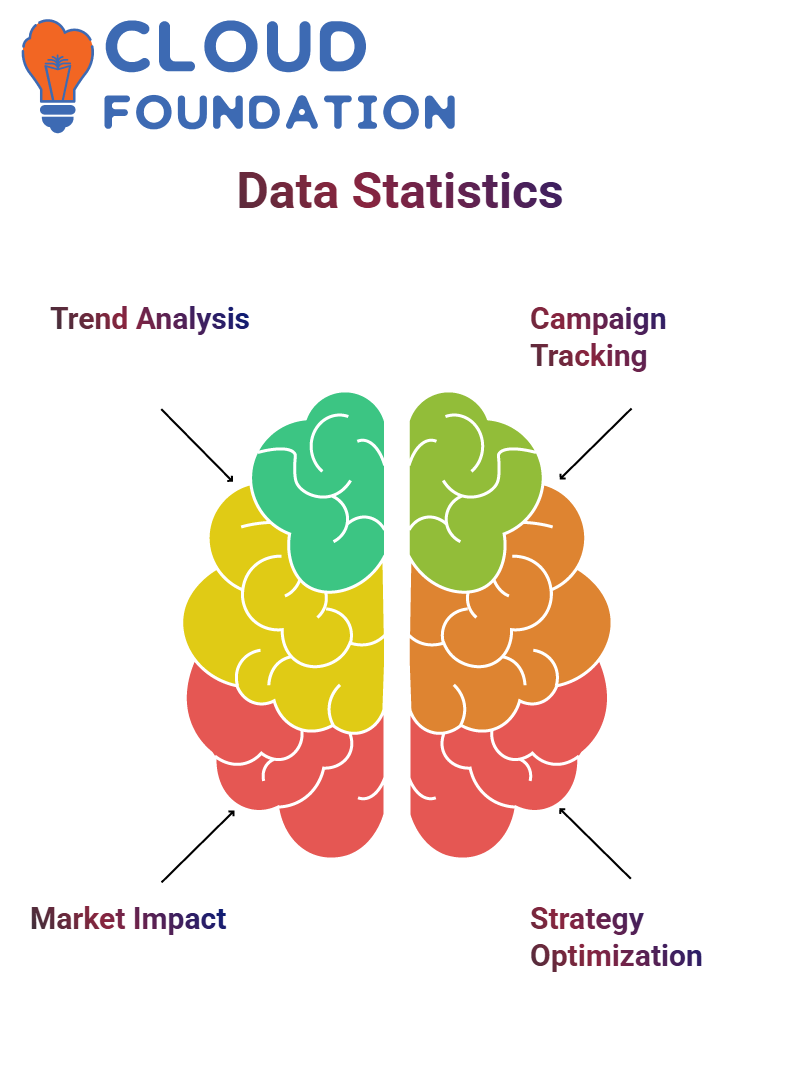
Unveiling Data Stories with Datorama
How do sudden spikes in data graphs often tell a tale?
With Datorama, these spikes are no longer a mystery.
They become opportunities to uncover what’s driving changes and understand why.
Whether it’s stock markets or sales funnels, Datorama helps identify the events behind data trends.
Everyone knows they fluctuate up and down like clockwork, often caused by news such as government policies or financial reports.
Datorama enables you to delve into these patterns, allowing you to understand why specific sectors, such as banks, respond in this manner.
Datorama should always be your go-to tool when you detect an upswing in campaigns or data, whether it’s launches, endorsements, or acquisitions.
Such events typically fall within your marketing funnel, and Datorama enables you to pinpoint what caused this surge.
Was it a new creative asset or new ads, perhaps?
Utilising these insights will enable you to fine-tune your strategy while sharing findings among team members.
Mastering Goals in Datorama
Track impressions over any given period, define goals that meet minimum, exact, or maximum criteria, and more to set specific, customised targets that meet all your requirements.
Once your goals have been set, monitoring becomes effortless with notifications from Datorama’s Activation Centre.
Select how and when you would like your notifications to be sent.
Whether via email, Slack, or Twilio, so your data goals always stay on target.
Reporting Made Easy with Datorama
Datorama stands out with its reporting features, anything processed through Datorama can be exported as reports with customisable formats and pivot tables, giving your data new clarity.
These intuitive features bring greater efficiency than Excel alone.
Integrating Datorama with Salesforce and Tableau
Datorama can serve as your automated repository if you use Salesforce and require Tableau visualisation of data.
So that data can easily be organised within Datorama before being connected.
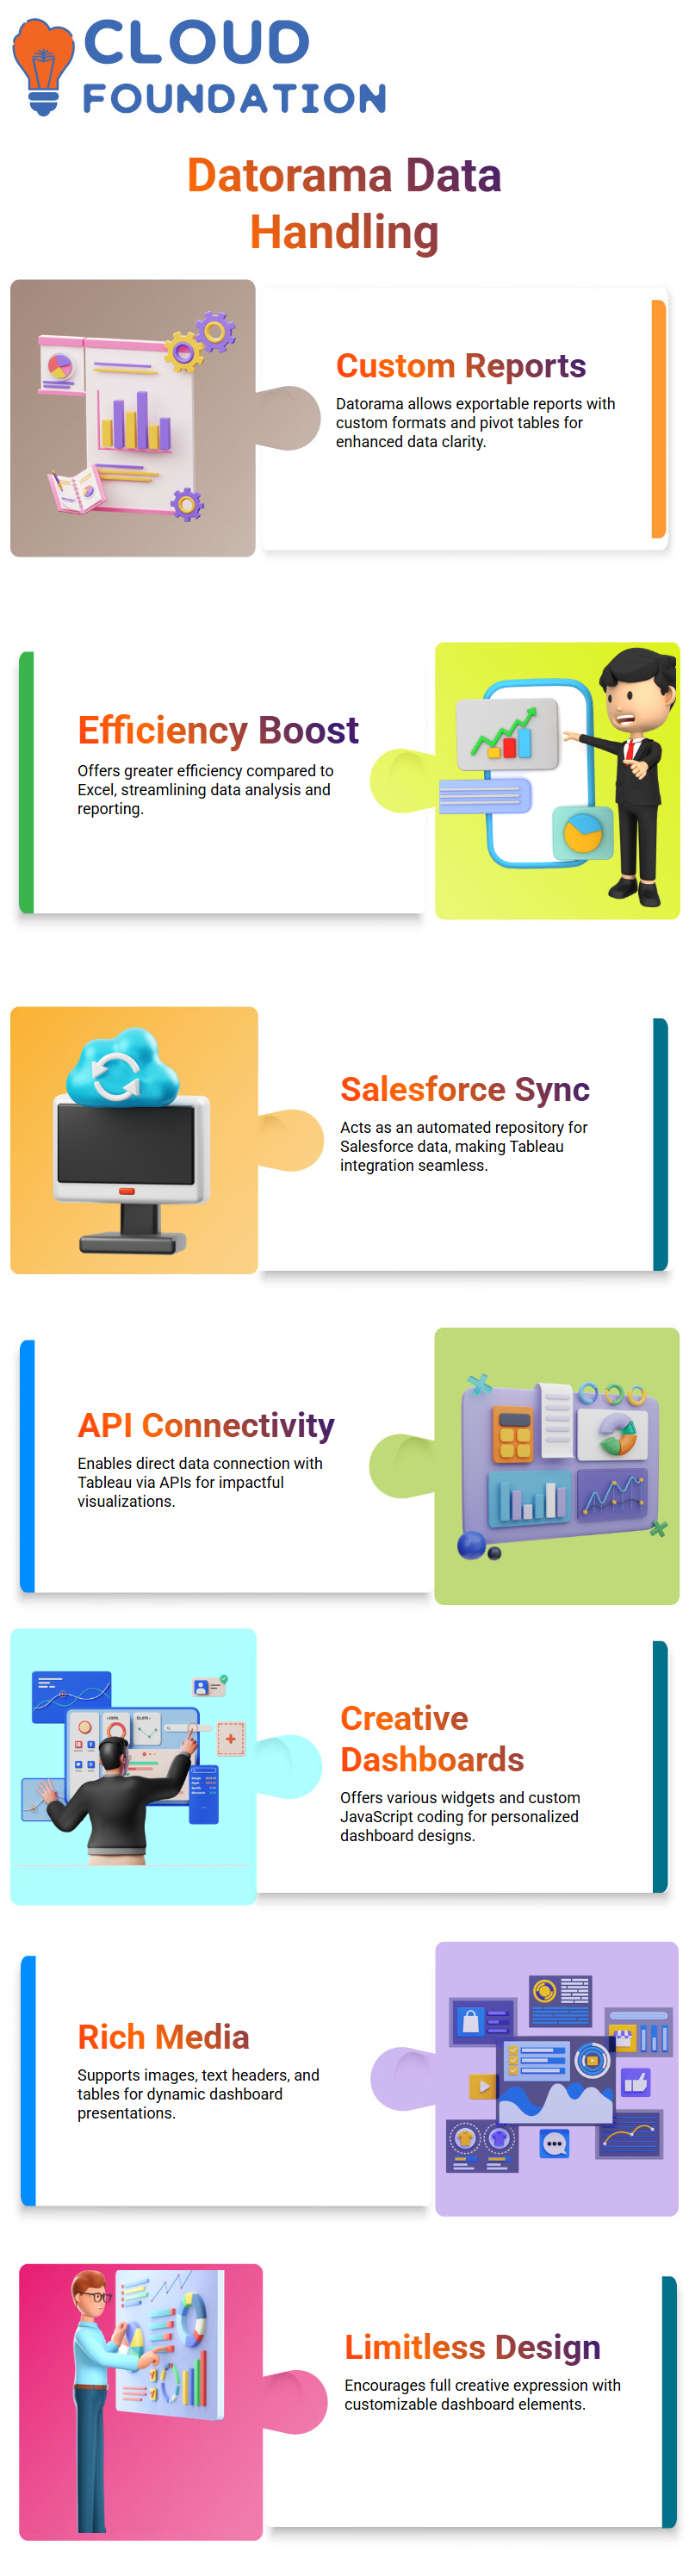
directly with Tableau through APIs, ensuring impactful visuals can be produced from it.
Exploring Dashboards with Datorama
Datorama dashboards provide the ideal canvas to showcase your creativity.
Choose from various pre-loaded widgets or code a custom dashboard utilising JavaScript.
There’s endless space to express yourself when designing dashboards for Datorama.
From images, rich text headers, or tables, your imagination is the only limit here.

Datorama Course Price

Sai Susmitha
Author