Datorama Dashboards & Datorama Reporting Tutorial
Introduction to Datorama Insights
How can Datorama revolutionise the way we visualise and optimise data?
Datorama simplifies data sheet classification by streamlining the categorisation of brand, audience indication, and start and end dates into easily customisable columns and views.
Switch dates with a single touch, while insights adapt seamlessly.
Filtering and optimising data has never been simpler with Datorama; filter, optimise, and view the results.
Data Concatenation with Datorama
Datorama enables me to quickly and effectively generate unique identifiers for datasets by concatenating columns into a single string identifier.
This step ensures each data point remains distinct, eliminating duplication.
Furthermore, its platform enables effortless combination of metrics and attributes, providing smooth filtering capabilities and generating valuable insights.

Datorama’s approach of concatenating keys is revolutionary.
By mapping unique numbers to generate keys, data streams are optimised effortlessly for displaying insights with minimal effort, a straightforward method provided by Datorama.
Optimising with Datorama Metrics
When working with non-ad data, generic streams help define attributes and metrics.
Mapped all the attributes, unique numbers, and generic metrics of my entities onto generic streams, making my process exceptionally efficient.
Filters play an invaluable role in Datorama.
By selecting primary entity keys and customising and optimising insights with filters, it becomes possible to customise data streams dynamically for maximum specificity of insights.
Using Datorama Rich Text Boxes
Datorama makes insights interactive through rich text boxes that display attributes and metrics dynamically.
Editing these boxes provides flexibility in showcasing optimisation highlights as well as detailed insights.
Datorama’s rich text functionality is ideal for accommodating multiple insights.
By mapping columns and queries, data can be displayed in bullet points for easier comprehension and actionable insights.
Filtering and Widgets in Datorama
Filters in Datorama are a fantastic feature.
By customising filters based on brands or metrics, you can tailor data streams to meet your specific needs.
Widgets enable the addition of particular filters instantly for brand insights.
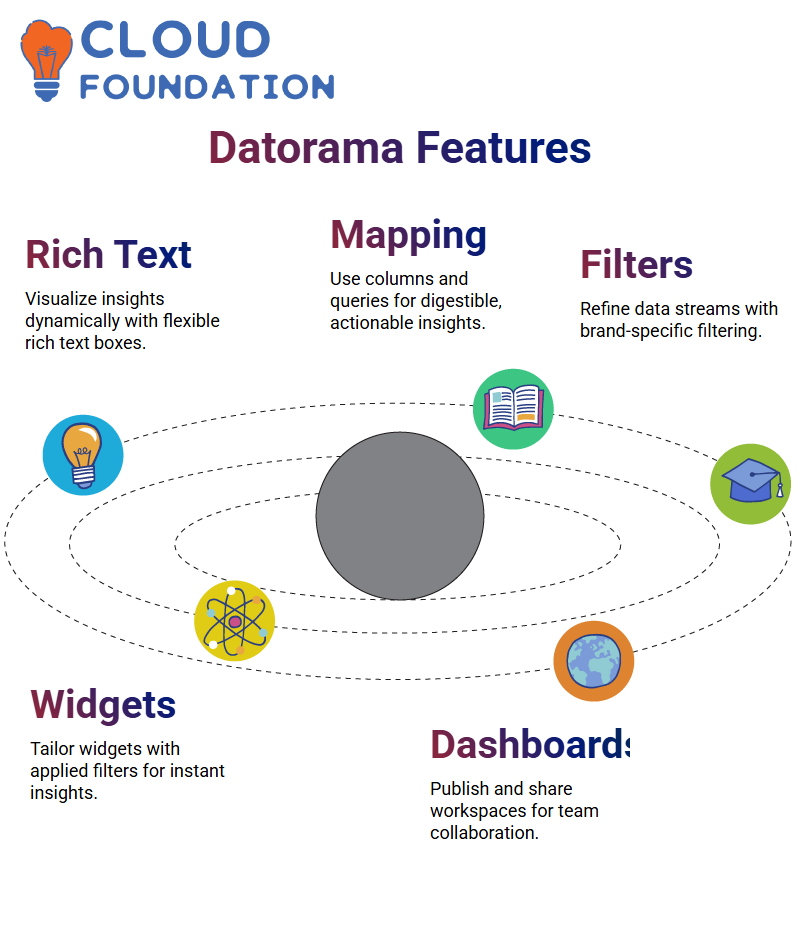
Every widget in Datorama can be tailored using filters to provide brand-specific insights, allowing for seamless and intuitive customisation.
If this is what you require, select your brand from Datorama’s list and apply the corresponding filter. Datorama makes this process seamless and user-friendly.
Understanding Datorama Dashboards
Datorama provides an efficient means of creating dashboards, and understanding how to publish them is crucial.
When an unpublished dashboard remains visible only within your login, enabling you to make edits before sharing with others, once published, however, anyone authorised for that workspace can view it.
Datorama doesn’t provide options to limit published dashboards in this setup.
However, visualisation PDFs make sharing content simpler, while the ability to adjust access and visibility allows teams to collaborate efficiently.
Setting Date Ranges in Datorama
When creating a Datorama dashboard, setting the correct date range is crucial.
Datorama enables users to filter data dynamically, ensuring that dashboards reflect the most relevant insights.
By configuring date filters correctly, you gain precise control over how historical data is analysed.
Adding Visuals to Datorama Dashboards
Graphs play a significant role in Datorama dashboards.
The platform enables users to add interactive filters and visual elements, enhancing data interpretation.
For instance, a bar chart in Datorama starts as a blank slate.
Adding measurements and dimensions transforms it into a meaningful visual representation.
By selecting campaign categories, users can tailor dashboards to their specific needs.
Filtering Data Streams in Datorama
Filters are an integral component of Datorama’s functionality, helping refine data streams for enhanced accuracy and providing relevant, actionable dashboard content.
Applying filters ensures that information is related to specific datasets, maximising the impact on dashboard use.
By selecting specific data streams, users can customise their dashboard view in Datorama for effective analytics.
Customising Charts in Datorama
Datorama enables users to customise chart settings with features such as colour adjustments and number precision formatting, thereby enhancing the clarity of insights while improving data visualisation.
By changing chart colours, insights become even clearer.
Chart design options, such as floating, fixed, and sticky elements, help structure dashboards effectively, providing users with an exceptional user experience when using Datorama dashboards.
Choosing between them ensures an optimal experience working with Datorama dashboards.
Predictive Analysis in Datorama
Forecasting with Datorama relies heavily on historical data.
Furthermore, Datorama supports predictive analysis, enabling users to make data-driven decisions.
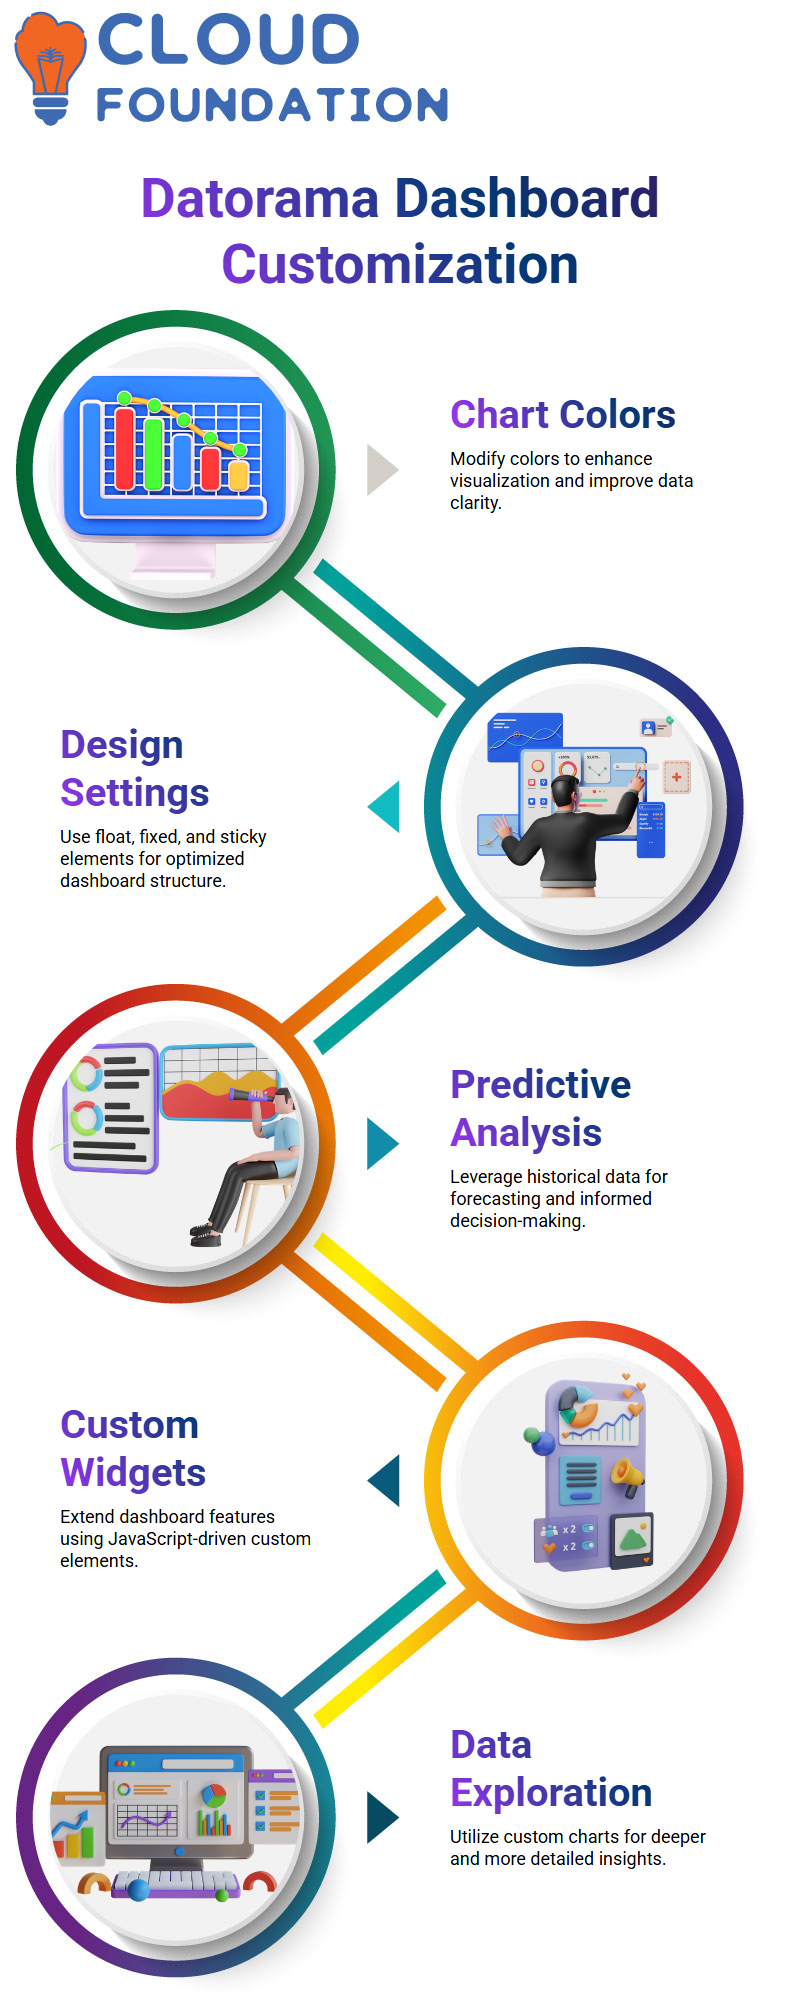
While Datorama doesn’t natively offer predictive modelling capabilities, custom widgets may help implement forecasting features.
Thanks to Datorama’s versatility and expandability, users have the power to extend beyond standard charts when adding forecasting features to forecasts and models.
Enhancing Datorama Dashboards with Custom Elements
Datorama provides advanced users with the capability to add customised widgets through JavaScript, extending their dashboard capabilities even further with complex visualisations.
Custom charts in Datorama enable even deeper data exploration, while its unlimited customizability capabilities make Datorama an invaluable asset for providing more in-depth reports.
Exploring Forecasting with Datorama
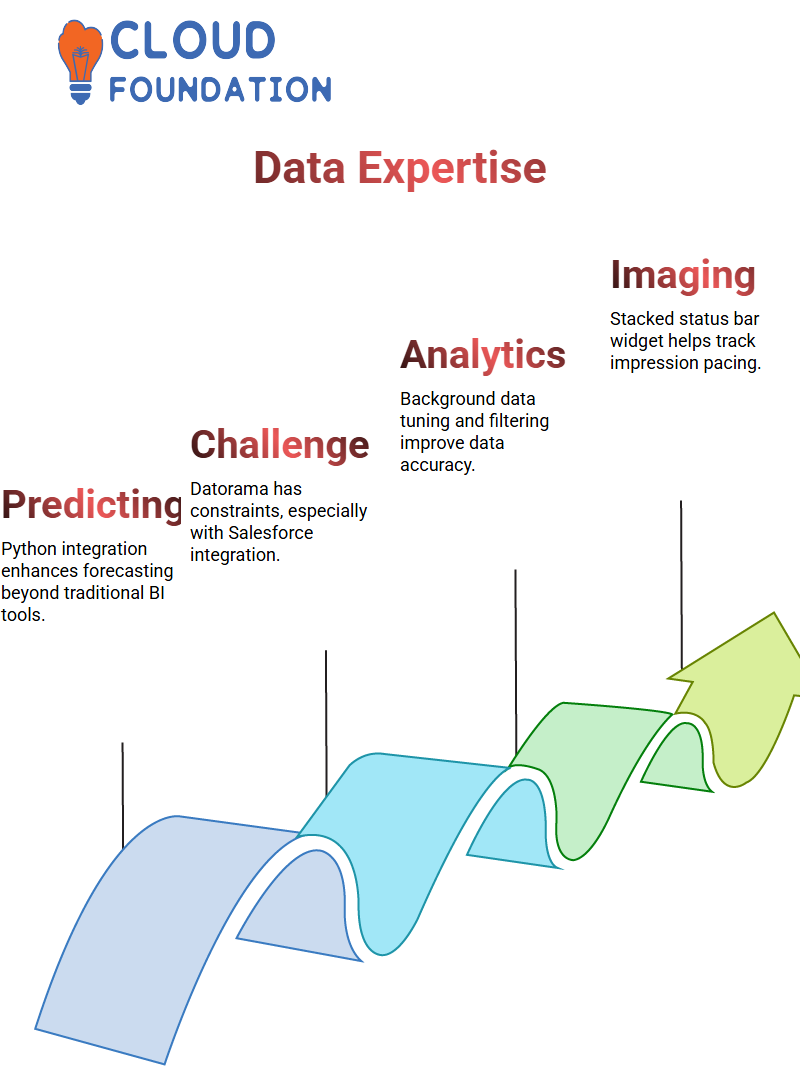
Datorama offers several forecasting options for forecasting projects, but I find that using Python with Datorama yields the best results for me.
Python enthusiasts may enjoy working with this combination beyond typical business intelligence (BI) tools; however, Datorama still has certain limitations when used in conjunction with platforms like Salesforce.
Datorama stands out in this respect with its ability to tune background data and offer customisable options, such as filtering and data streaming features, which have proven indispensable in maintaining the accuracy and relevance of my data sets.
Visualising Data with Datorama
Datorama’s widgets help bring data to life. The stacked status bar widget enables the practical visual demonstration of impression pacing.
It allows for the addition of filters and data streams in Datorama, ensuring that accurate insights are displayed in its visualisations.
Additionally, customising them specifically suits specific needs, something Datorama makes easy.
Datorama makes tracking impressions easy. Adjust a slider, add data dimensions, and track their flow across any period, with its Pacing graphs providing an unparalleled way to visualise performance metrics.
Creating and Managing Goals in Datorama
Setting goals on Datorama has always been an enjoyable process for me.
Starting from its Analyse and Act section, I can set specific target counts, such as clicks.
Furthermore, Datorama enables me to segment my goals into ranges, making it much simpler to track progress.
Datorama provides me with valuable historical data for refining my goals in real-time, such as by setting targets like 20 clicks, which helps me visualise their success through the goal widget.
Real-time adjustments to goals have proven extremely helpful in tracking performance.
Interactive Filters and Dimensions in Datorama
Filters in Datorama are easy and powerful tools. By applying filters to widgets, you can efficiently sort data according to categories such as campaign type or specific data streams, helping to ensure focus on only the relevant metrics.
Datorama provides me with another feature: its switch dimension widget. Capable of accommodating multiple dimensions simultaneously, this versatile data exploration tool gives me all
Getting Started with Datorama
Datorama provides powerful business information combined with user-friendly analytics in one streamlined platform, and vouches for its visualisation generator, which never ceases to surprise me with helpful suggestions for widgets that make things run smoother.
Widgets: The Heart of Datorama
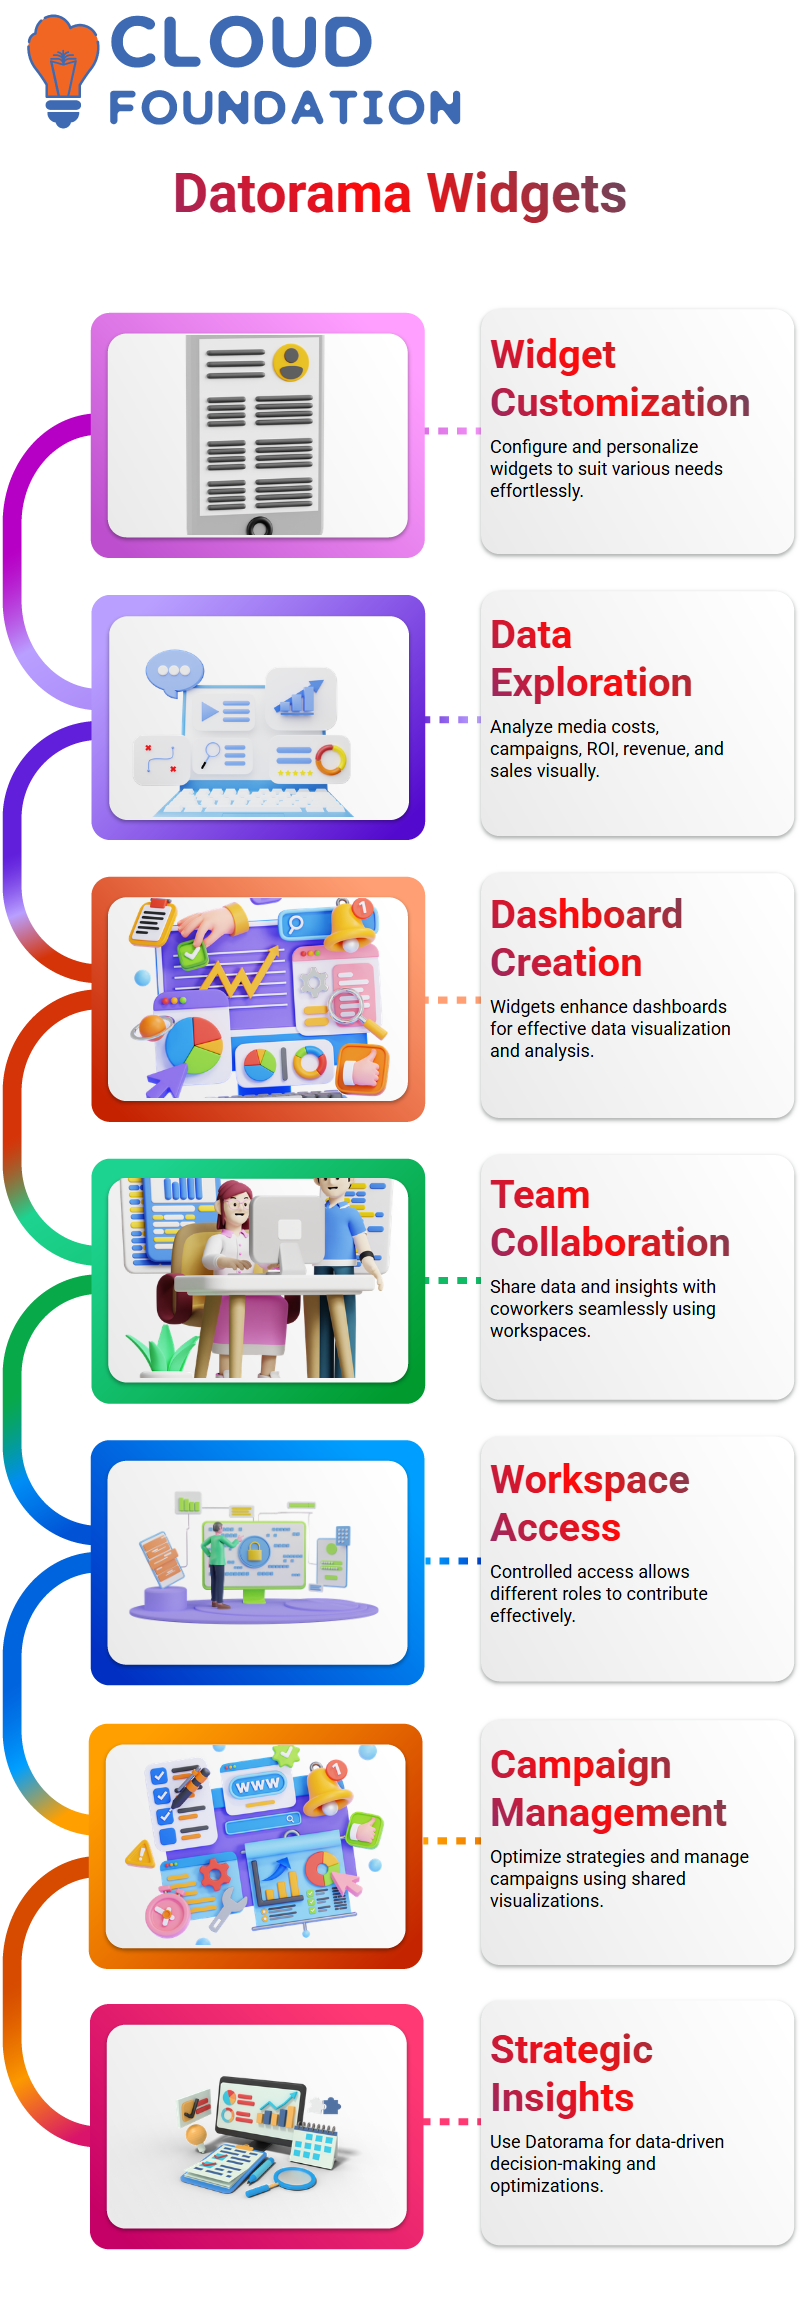
Datorama offers an incredible feature that allows you to configure and customise widgets to suit your specific needs, including the types, placements, and methods for improving their appearance.
Widgets enable the exploration of media costs, campaign spreads, and advanced visuals, including ROI, revenue, and sales data.
Whether creating dashboards or collaborating with your coworkers, widgets are integral to the Datorama experience.
Collaborating with Coworkers Using Datorama
Datorama excels in collaboration. Just imagine working on the display part while your colleague handles the search.
With workspace-level access, you can share data, insights and optimisations effortlessly.
Workspaces in Datorama enable everyone involved in creating stunning visualisations and stories to collaborate, with access granted based on their role, ranging from admins to power users.
You’ll find this particularly beneficial when managing campaigns or optimising strategies.
Three Pillars of Datorama
Datorama operates under three main pillars: Connect and Mix, Analyse and Act, and Visualise.
Connect and Mix is where your journey with data begins: you link sources together and classify or harmonise everything at the outset – this part is very intuitive.
Analysis and Action are as follows, providing the ability to generate reports and set business goals based on harmonised data.
Visualise is the final stage, in which users create dashboards, pages, and widgets to customise their view of data in a clear and easily understandable manner.
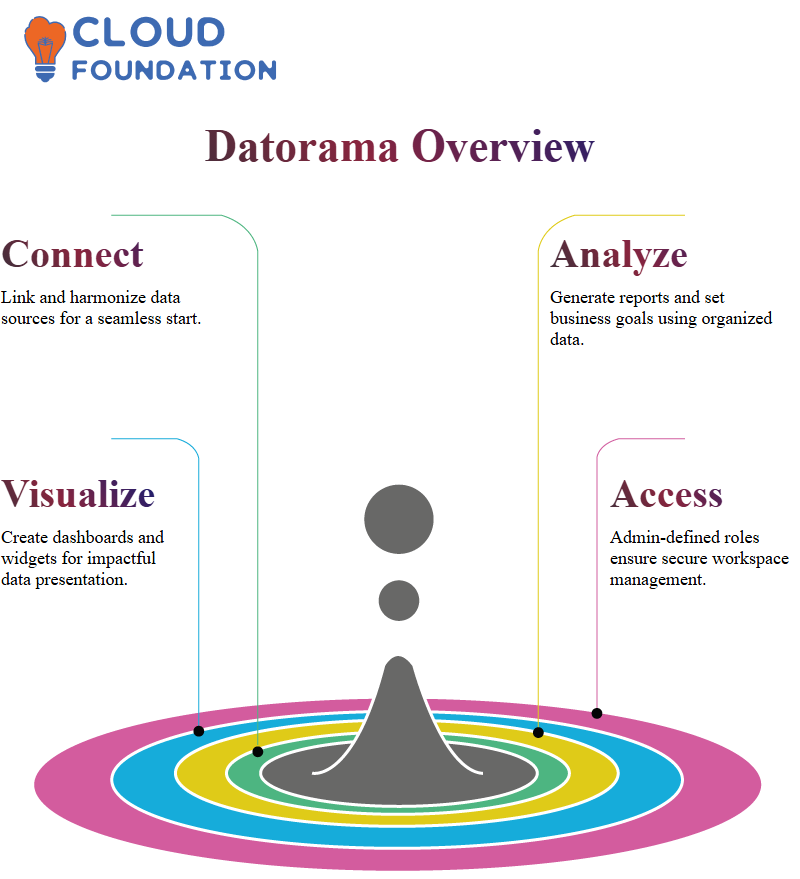
Find it invaluable when it comes to effectively communicating our findings.
Workspaces in Datorama
Workspaces on Datorama serve as data playgrounds. Here you can create placeholders for advertisers, customers or agencies and organise data effectively.
Admins determine access levels in workspaces.
Datorama’s workspace management ensures that everyone has the appropriate levels of permission in place to work effectively.
Automating Data with Datorama
Automation is at the core of Datorama, from integrating Excel files and APIs to scheduling and automating data updates for ease of use.
As someone who works extensively with APIs within Datorama, this feature stands out; integration and automation couldn’t be any simpler or faster.
Understanding Datorama’s Pricing Model
Datorama makes its costs transparent; their pricing method is based on the number of rows used by your operational activities.
Costs will depend on this number, and you have access to an allocated set number of rows before incurring extra fees per row after exceeding that limit.
As this pricing scheme emphasises efficiency in data management to prevent unnecessary expenses from accruing over time, this row-based pricing facilitates cost control across your operational activities.
The Importance of Data Harmonisation in Datorama
Datorama provides robust tools, including Connect and Mix, to streamline data integration and analysis.
These features enable you to connect diverse data sources and utilise various connectors that Datorama offers.
Whether you’re accessing APIs like Adobe Analytics or Google Analytics, these integrations simplify your data processes.
Leveraging Datorama’s Connect and Mix Features
Datorama offers powerful data integration tools, such as Connect and Mix, that simplify data processing and analysis.
These features enable the connection of different data sources, as well as more manageable access to APIs such as Adobe Analytics or Google Analytics.
Exploring Datorama’s Total Connect Functionality
Total Connect is an innovative feature in Datorama that enables data integration beyond APIs, allowing for the inclusion of offline sales metrics and email metrics.
With Total Connect’s seamless data ingestion and modelling features, Total Connect helps create in-depth insights without compromising data quality or creating gaps between data sources.

Data Mapping and Classification in Datorama
Data mapping in Datorama involves aligning raw data columns with existing model fields to integrate your data into workflows and processes accurately.
Furthermore, Datorama classifies its data into dimensions and measurements.
Dimensions represent qualitative aspects, such as campaign names or country codes, while measurements cover quantifiable information, like impressions or spending figures.
Understanding these distinctions will enable you to fully leverage Datorama’s capabilities.
Understanding Datorama Portfolio Insights
When I consider managing portfolios, I think of their various components, including equity investments, mutual funds, pension schemes, options, and futures.
For instance, his portfolio showcases all these features as evidence of his financial standing.
At the same time, Datorama goes further by providing us with actionable insights that extend beyond this narrative.
Datorama can help distinguish dimensions from measurements.
Dimensions refer to qualitative aspects, such as campaign names or delivery methods, while measurements, like clicks or impressions, provide quantitative data that you need for practical analysis in Datorama.
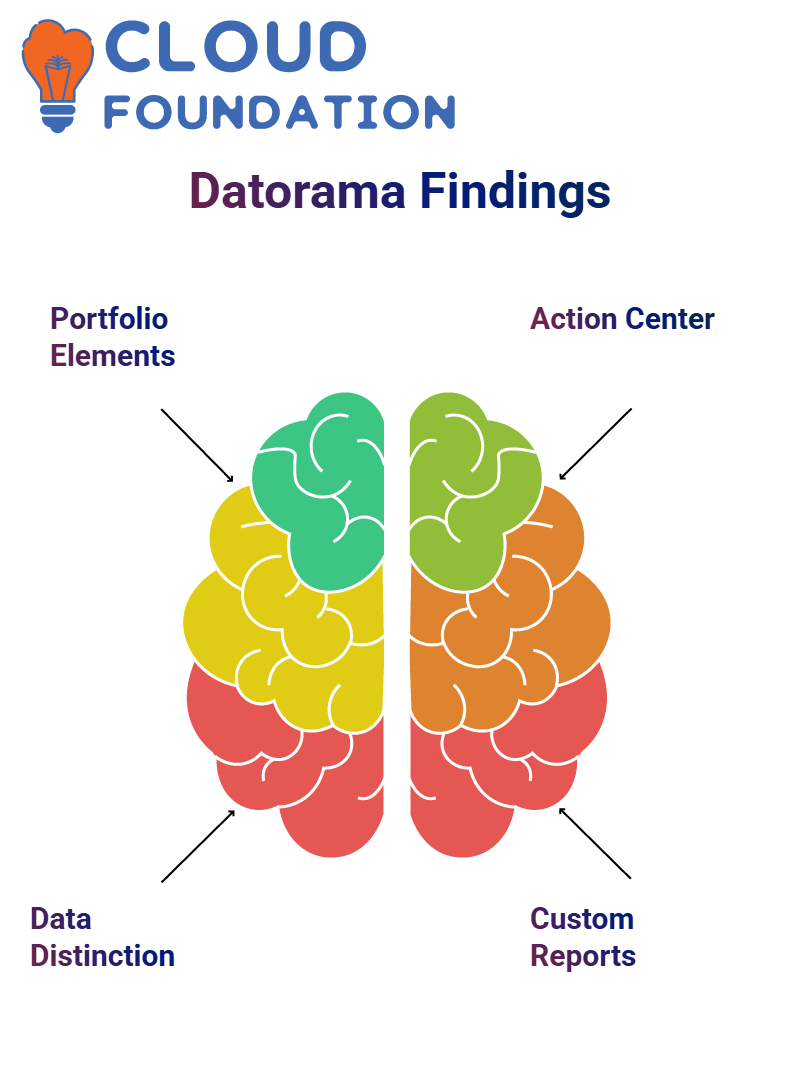
This distinction is key in creating accurate insights from data.
Analysing and Acting with Datorama
Datorama’s Analyse and Act tab serves as your action centre, equipped with tools such as goals, scorecards, reports, and pivot tables to enable action on any data extracted from Datorama – including harmonised data from multiple streams (such as search data performance in May) that is extracted as reports.
Datorama reports are highly customisable. Select from export formats, including Excel or CSV, as well as periods, such as 30 days or specific weeks.
Measurements, including clicks or impressions, as well as dimensions like campaigns, can all be tailored specifically for you, so you obtain precisely the information necessary for analysis.
Mastering Reports in Datorama
Datorama makes creating reports easy for quality checks or merging datasets, and exports can be scheduled daily, weekly, or monthly with delivery methods including email and secure FTP, so your critical data remains accessible at the right moment.
Additionally, its report scheduler enables notifications, ensuring everyone is on board.
Datorama ensures your goals and data synchronisation remain on target with its automated schedules, helping streamline workflows.
For instance, when goals are reached at 3 a.m., you can immediately notify your team through third-party connectors like Twilio or Slack, helping to keep them on track with deadlines and progress.
Setting Goals with Datorama
Datorama makes goal setting simple with flexible settings to meet individual, range, or time-specific targets.
For instance, you could monitor at least 100 clicks within any period or between 100 and 200 clicks within any specific timeframe.
Then, Datorama notifies you when these targets have been reached.
By customising dimensions, measurements, and periods to align with your overall strategies, you can ensure your goals align with Datorama’s granular tracking capabilities and track progress seamlessly and efficiently.
Visualising Data in Datorama
Datorama’s Visualise tab transforms your data into meaningful dashboards that you can tailor specifically to meet your needs, whether channel-specific dashboards for social, search, or display, or comprehensive views encompassing multiple channels.
Dashboard widgets provide detailed insights, including revenue goals, marketing objectives, and channel analysis.
Features like forecasting and KPI trends make these dashboards indispensable tools for data-driven decision-making at Datorama.

Optimising Workspaces in Datorama
Datorama provides robust workspace management capabilities.
This feature is beneficial for teams tackling multiple projects simultaneously.
Through user settings, administrators can manage credentials, allowing users to transition seamlessly between different workspaces.
Datorama’s workspaces facilitate collaboration by providing everyone with access to all necessary tools and data required for projects or training sessions, keeping everything neatly organised while remaining easily accessible.

Sai Susmitha
Author


